> ## Documentation Index
> Fetch the complete documentation index at: https://docs.codeant.ai/llms.txt
> Use this file to discover all available pages before exploring further.
# DORA Metrics
> Track and Improve Your Software Delivery Performance with Industry-Standard Metrics
## Overview
CodeAnt AI's DORA Metrics feature provides comprehensive insights into your software delivery performance using the four key metrics established by the DevOps Research and Assessment (DORA) team. These metrics help you measure, benchmark, and improve your engineering team's effectiveness and delivery capabilities.
Metrics are automatically benchmarked against industry standards across four performance levels: **Elite**, **High**, **Medium**, and **Low**.
Each repository tracks deployments in one of two modes:
| Mode | What counts as a deployment | Best for |
| ------------------------------------- | --------------------------------------------------------------------------------------------------------------------------------------------------------------- | ------------------------------------------------------------------------------------------------------------------------- |
| **Merge-based** (`PR_MERGE`, default) | A pull request merged into a production branch. A proxy - your CI/CD pipeline is not observed. | Teams that deploy on every merge (trunk-based continuous deployment). |
| **Pipeline deployments** (`PIPELINE`) | A successful run of your production pipeline stage / environment. Deployment Frequency, Change Failure Rate, and MTTR are computed from real CI/CD deployments. | Teams whose deploys are pipeline runs decoupled from merges - release branches, scheduled releases, redeploys, rollbacks. |
See [Pipeline Deployment Mode](#pipeline-deployment-mode) for setup.
### Supported Providers
DORA Metrics are available for the following Git providers:
| Provider | Cloud | Self-Hosted |
| ------------ | ----- | ----------------- |
| GitHub | Yes | Yes |
| GitLab | Yes | Yes |
| Bitbucket | Yes | Yes (Data Center) |
| Azure DevOps | Yes | Yes |
***
## Team Control
Teams in DORA Metrics are **collections of repositories** grouped together for aggregated metrics tracking. A team allows you to view combined DORA metrics across all repositories within it, or drill down into individual repository performance while preserving team-level configuration.
### Creating a Team
Navigate to the DORA Metrics section and click **Create Team** to set up a new team.
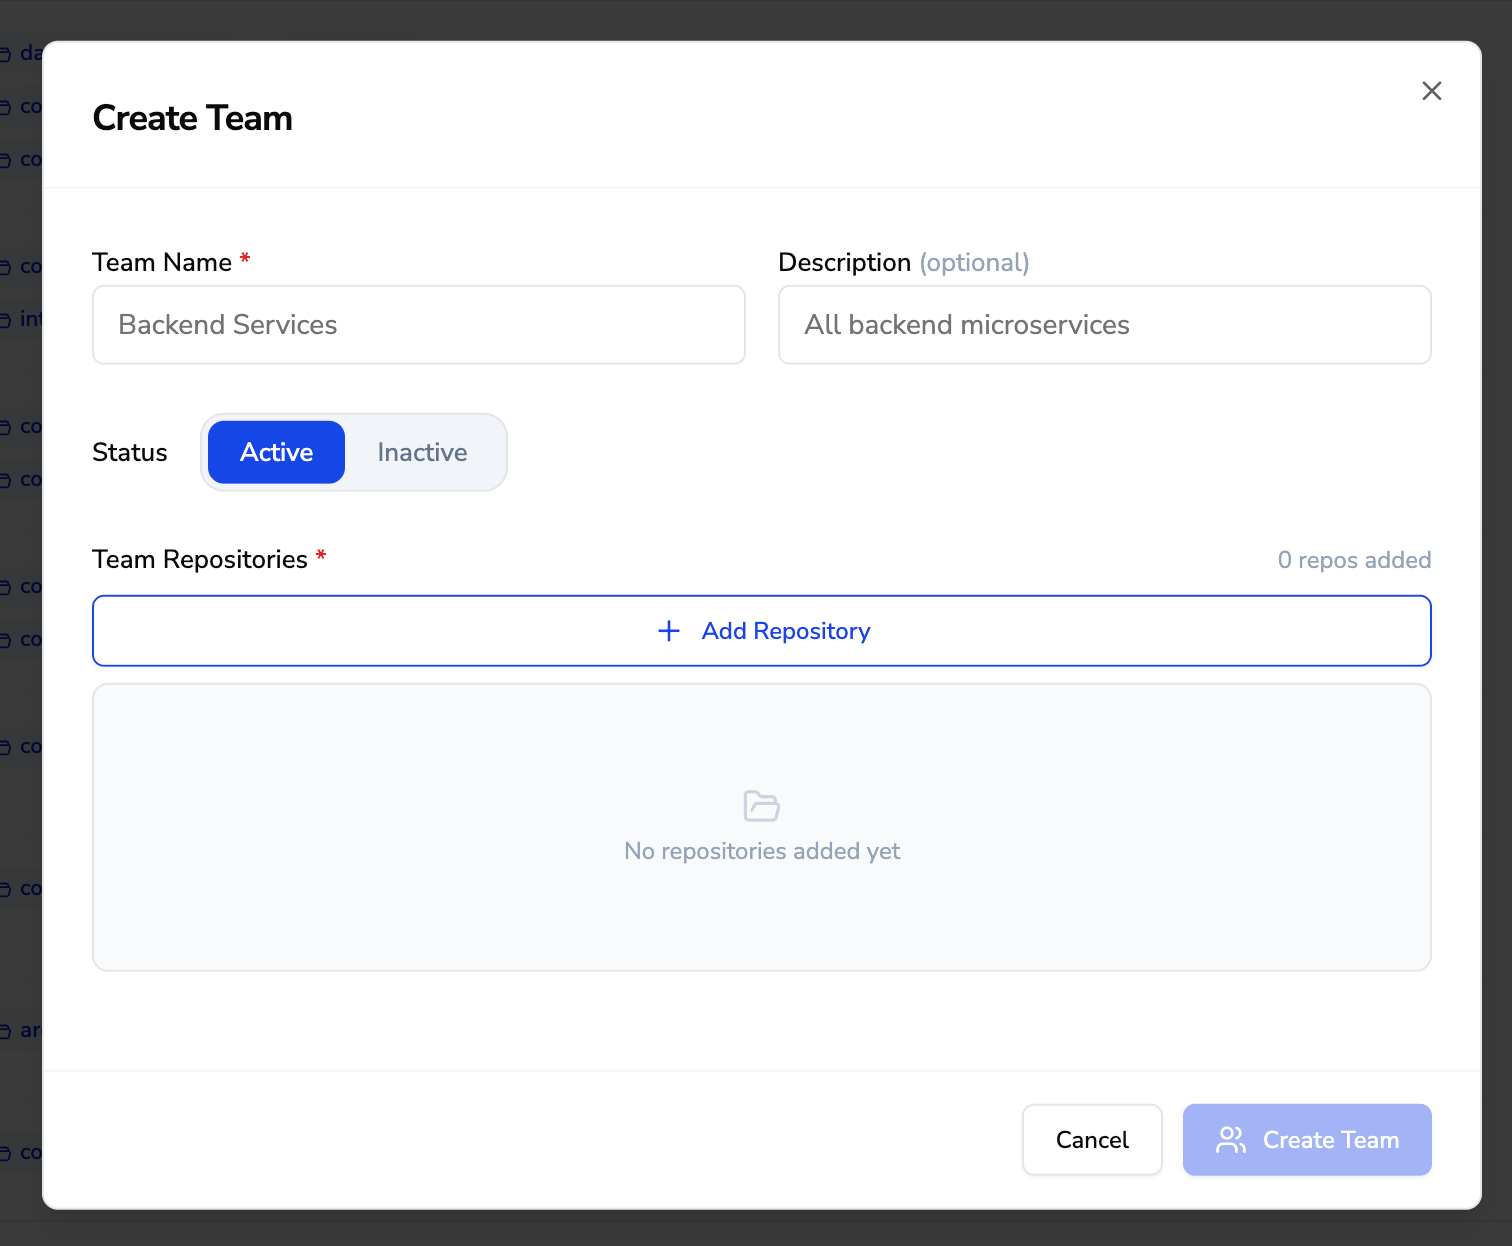 When creating a team, you configure the following fields:
| Field | Required | Description |
| --------------------- | -------- | ---------------------------------------------------------------------------------------------------------------------------------------------------------------------------------------------- |
| **Team Name** | Yes | A descriptive name for the team (2-100 characters). Example: `Backend Services`, `Platform Team`. |
| **Description** | No | An optional description of the team's purpose or scope. |
| **Status** | Yes | Set the team as **Active** or **Inactive**. Only active teams appear in the dashboard by default. |
| **Team Repositories** | Yes | List of repositories to include in the team. Click **+ Add Repository** to add repos. Each added repository is configured with a **Deployment Type** and **Prod Branch Patterns** (see below). |
#### Adding a Repository
When you add a repository to a team, you configure how deployments are tracked for that repo:
When creating a team, you configure the following fields:
| Field | Required | Description |
| --------------------- | -------- | ---------------------------------------------------------------------------------------------------------------------------------------------------------------------------------------------- |
| **Team Name** | Yes | A descriptive name for the team (2-100 characters). Example: `Backend Services`, `Platform Team`. |
| **Description** | No | An optional description of the team's purpose or scope. |
| **Status** | Yes | Set the team as **Active** or **Inactive**. Only active teams appear in the dashboard by default. |
| **Team Repositories** | Yes | List of repositories to include in the team. Click **+ Add Repository** to add repos. Each added repository is configured with a **Deployment Type** and **Prod Branch Patterns** (see below). |
#### Adding a Repository
When you add a repository to a team, you configure how deployments are tracked for that repo:
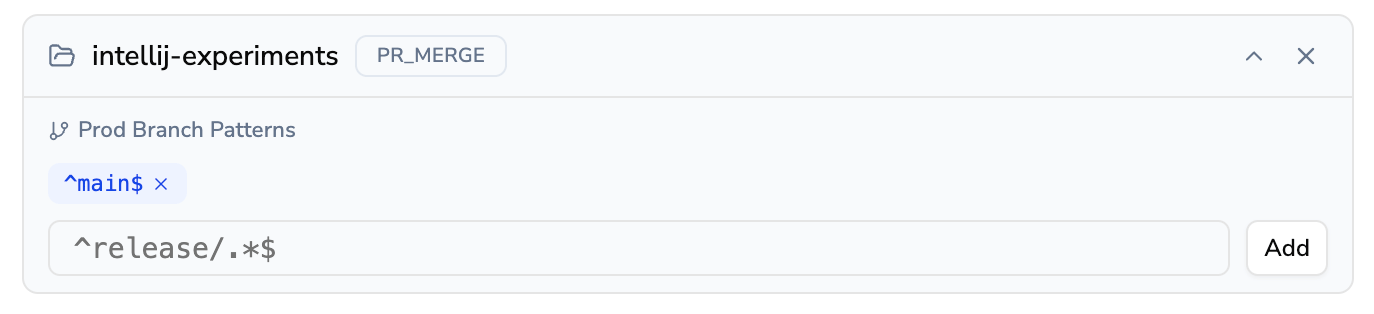 | Field | Default | Description |
| ------------------------------------- | ------------- | ------------------------------------------------------------------------------------------------------------------------------------------------------------------------------------------------------------------------------------------------------------------------------------------------------------------------ |
| **Repository** | - | The repository to add (e.g., `intellij-experiments`). |
| **Deployment Mode** | `Merge-based` | Defines what counts as a deployment: **Merge-based** (a merged pull request into a production branch) or **Pipeline deployments** (a successful production pipeline stage / environment run). See [Pipeline Deployment Mode](#pipeline-deployment-mode). |
| **Prod Branch Patterns** | `^main$` | Regex patterns that identify your production branches. In merge-based mode, only PRs merged into matching branches count as deployments; in pipeline mode, only pipeline runs *of* matching branches count. You can add multiple patterns - for example, `^main$` and `^release/.*$`. Click **Add** to add each pattern. |
| **Prod Stage / Environment Patterns** | `(?i)prod` | *(Pipeline mode only)* Regex patterns matching the pipeline stages or environments that represent production - e.g. `(?i)prod` matches `production` and `exxat-prod`. Runs of non-matching stages (staging, QA) are ignored. |
| **Pipeline IDs** | *(all)* | *(Pipeline mode, Azure DevOps only)* Optional comma-separated pipeline definition IDs. When set, only those pipelines are considered. |
A team can freely mix modes - some repositories merge-based, others pipeline-based. Each metric uses the right data source per repository, and the dashboard descriptions adapt to the selected scope.
### Pipeline Deployment Mode
Switch a repository to **Pipeline deployments** when merges and deploys are not the same event - for example, a release branch that accumulates many PRs and then ships once from a pipeline. In this mode, Deployment Frequency, Change Failure Rate, and MTTR are computed from your actual CI/CD deployments instead of merged PRs.
#### Provider support and requirements
| Provider | Deployment source | Requirements |
| ---------------- | -------------------------------------------------------------------------------------------------------------------------------------------------- | ----------------------------------------------------------------------------------------------------------------------------------------------------------------------------------------------- |
| **Azure DevOps** | Multi-stage YAML pipeline **stages** (Builds API + timeline) | The integration token must include the **Build (Read)** scope. If PR reviews work but no deployments appear, update the PAT embedded in your CodeAnt service-hook URLs to one that includes it. |
| **GitHub** | **Deployments / environments** (created automatically when an Actions job declares `environment:`, or by deploy tools calling the Deployments API) | Deploy workflow jobs must declare an `environment:` (e.g. `production`). |
| **GitLab** | **Deployments / environments** (created when a CI job declares `environment:`) | Deploy jobs must declare an `environment:`. |
| **Bitbucket** | Not yet supported | Pipeline mode is rejected for Bitbucket repositories; merge-based mode remains available. |
**Azure DevOps: the token must include the Build (Read) scope.** CodeAnt reads pipeline runs through the Azure DevOps Builds API, which requires **Build (Read)** in addition to the Code scopes used for PR reviews. Tokens created only for code access will return `401` on the Builds API - the symptom is that PR reviews keep working normally while pipeline mode shows **zero deployments**.
To fix it:
1. Create a Personal Access Token that includes **Build (Read)** alongside your existing Code scopes (or edit the existing PAT's scopes).
2. Update the `access_token` parameter in your CodeAnt service-hook URLs (Azure DevOps **Project Settings → Service Hooks**) with the new token, on every project connected to CodeAnt.
Deployments start appearing on the next collection cycle - no other reconfiguration is needed.
#### Setup
1. *(Azure DevOps)* Verify the integration token includes the **Build (Read)** scope - see the warning above.
2. Open **Team Controls**, expand the repository, and switch **Deployment Mode** to **Pipeline deployments**.
3. Set **Prod Branch Patterns** to the branches your production pipeline deploys from (e.g. `^releases/.*$`).
4. Set **Prod Stage / Environment Patterns** to match your production stage or environment names. The default `(?i)prod` covers any name containing "prod"; use `^production$` for an exact match.
5. *(Azure DevOps, optional)* Restrict to specific pipelines with **Pipeline IDs**.
Deployment data for team repositories is collected continuously regardless of mode, so switching a repository to pipeline mode shows its deployment history immediately. Stage and branch patterns are applied at read time - changing them takes effect on the next dashboard refresh, with no re-ingestion needed.
**Azure DevOps notes:** single-stage YAML pipelines report one implicit stage named `__default` - use `__default` (or `.*`) as the stage pattern for those. Historical coverage is limited by Azure DevOps build retention (about 30 days by default unless runs are retained); days already collected are kept by CodeAnt even after Azure DevOps purges the runs, so coverage accumulates forward from enablement.
### Managing Teams
The Team Controls page lists all your teams with their repositories, branch rules, and status at a glance.
| Field | Default | Description |
| ------------------------------------- | ------------- | ------------------------------------------------------------------------------------------------------------------------------------------------------------------------------------------------------------------------------------------------------------------------------------------------------------------------ |
| **Repository** | - | The repository to add (e.g., `intellij-experiments`). |
| **Deployment Mode** | `Merge-based` | Defines what counts as a deployment: **Merge-based** (a merged pull request into a production branch) or **Pipeline deployments** (a successful production pipeline stage / environment run). See [Pipeline Deployment Mode](#pipeline-deployment-mode). |
| **Prod Branch Patterns** | `^main$` | Regex patterns that identify your production branches. In merge-based mode, only PRs merged into matching branches count as deployments; in pipeline mode, only pipeline runs *of* matching branches count. You can add multiple patterns - for example, `^main$` and `^release/.*$`. Click **Add** to add each pattern. |
| **Prod Stage / Environment Patterns** | `(?i)prod` | *(Pipeline mode only)* Regex patterns matching the pipeline stages or environments that represent production - e.g. `(?i)prod` matches `production` and `exxat-prod`. Runs of non-matching stages (staging, QA) are ignored. |
| **Pipeline IDs** | *(all)* | *(Pipeline mode, Azure DevOps only)* Optional comma-separated pipeline definition IDs. When set, only those pipelines are considered. |
A team can freely mix modes - some repositories merge-based, others pipeline-based. Each metric uses the right data source per repository, and the dashboard descriptions adapt to the selected scope.
### Pipeline Deployment Mode
Switch a repository to **Pipeline deployments** when merges and deploys are not the same event - for example, a release branch that accumulates many PRs and then ships once from a pipeline. In this mode, Deployment Frequency, Change Failure Rate, and MTTR are computed from your actual CI/CD deployments instead of merged PRs.
#### Provider support and requirements
| Provider | Deployment source | Requirements |
| ---------------- | -------------------------------------------------------------------------------------------------------------------------------------------------- | ----------------------------------------------------------------------------------------------------------------------------------------------------------------------------------------------- |
| **Azure DevOps** | Multi-stage YAML pipeline **stages** (Builds API + timeline) | The integration token must include the **Build (Read)** scope. If PR reviews work but no deployments appear, update the PAT embedded in your CodeAnt service-hook URLs to one that includes it. |
| **GitHub** | **Deployments / environments** (created automatically when an Actions job declares `environment:`, or by deploy tools calling the Deployments API) | Deploy workflow jobs must declare an `environment:` (e.g. `production`). |
| **GitLab** | **Deployments / environments** (created when a CI job declares `environment:`) | Deploy jobs must declare an `environment:`. |
| **Bitbucket** | Not yet supported | Pipeline mode is rejected for Bitbucket repositories; merge-based mode remains available. |
**Azure DevOps: the token must include the Build (Read) scope.** CodeAnt reads pipeline runs through the Azure DevOps Builds API, which requires **Build (Read)** in addition to the Code scopes used for PR reviews. Tokens created only for code access will return `401` on the Builds API - the symptom is that PR reviews keep working normally while pipeline mode shows **zero deployments**.
To fix it:
1. Create a Personal Access Token that includes **Build (Read)** alongside your existing Code scopes (or edit the existing PAT's scopes).
2. Update the `access_token` parameter in your CodeAnt service-hook URLs (Azure DevOps **Project Settings → Service Hooks**) with the new token, on every project connected to CodeAnt.
Deployments start appearing on the next collection cycle - no other reconfiguration is needed.
#### Setup
1. *(Azure DevOps)* Verify the integration token includes the **Build (Read)** scope - see the warning above.
2. Open **Team Controls**, expand the repository, and switch **Deployment Mode** to **Pipeline deployments**.
3. Set **Prod Branch Patterns** to the branches your production pipeline deploys from (e.g. `^releases/.*$`).
4. Set **Prod Stage / Environment Patterns** to match your production stage or environment names. The default `(?i)prod` covers any name containing "prod"; use `^production$` for an exact match.
5. *(Azure DevOps, optional)* Restrict to specific pipelines with **Pipeline IDs**.
Deployment data for team repositories is collected continuously regardless of mode, so switching a repository to pipeline mode shows its deployment history immediately. Stage and branch patterns are applied at read time - changing them takes effect on the next dashboard refresh, with no re-ingestion needed.
**Azure DevOps notes:** single-stage YAML pipelines report one implicit stage named `__default` - use `__default` (or `.*`) as the stage pattern for those. Historical coverage is limited by Azure DevOps build retention (about 30 days by default unless runs are retained); days already collected are kept by CodeAnt even after Azure DevOps purges the runs, so coverage accumulates forward from enablement.
### Managing Teams
The Team Controls page lists all your teams with their repositories, branch rules, and status at a glance.
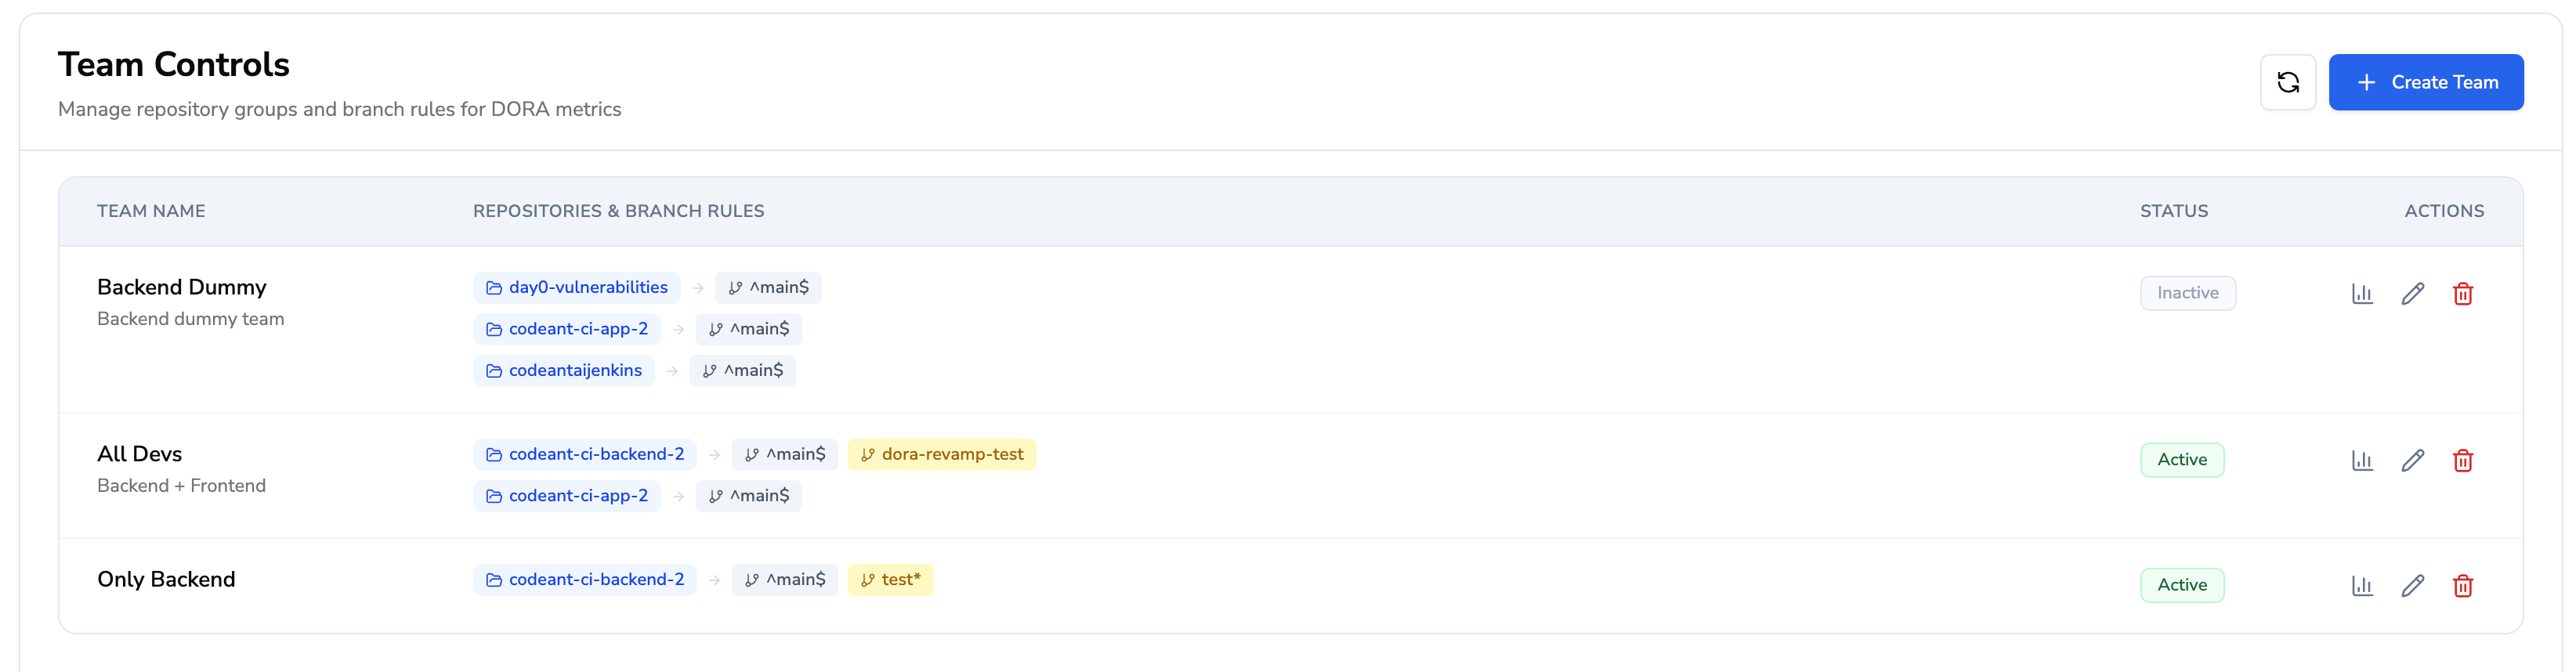 Each row shows:
* **Team Name** and description
* **Repositories & Branch Rules** - the repos in the team along with their configured production branch patterns
* **Status** - Active or Inactive
* **Actions** - View metrics, edit, or delete the team
From this page you can:
* **Add repositories** to an existing team
* **Remove repositories** from a team
* **Update repository config** - change the production branches or deployment type for a specific repository within the team
* **Edit team details** - update the team name, description, or active status
* **Delete a team** - delete the team
***
## DORA Dashboard
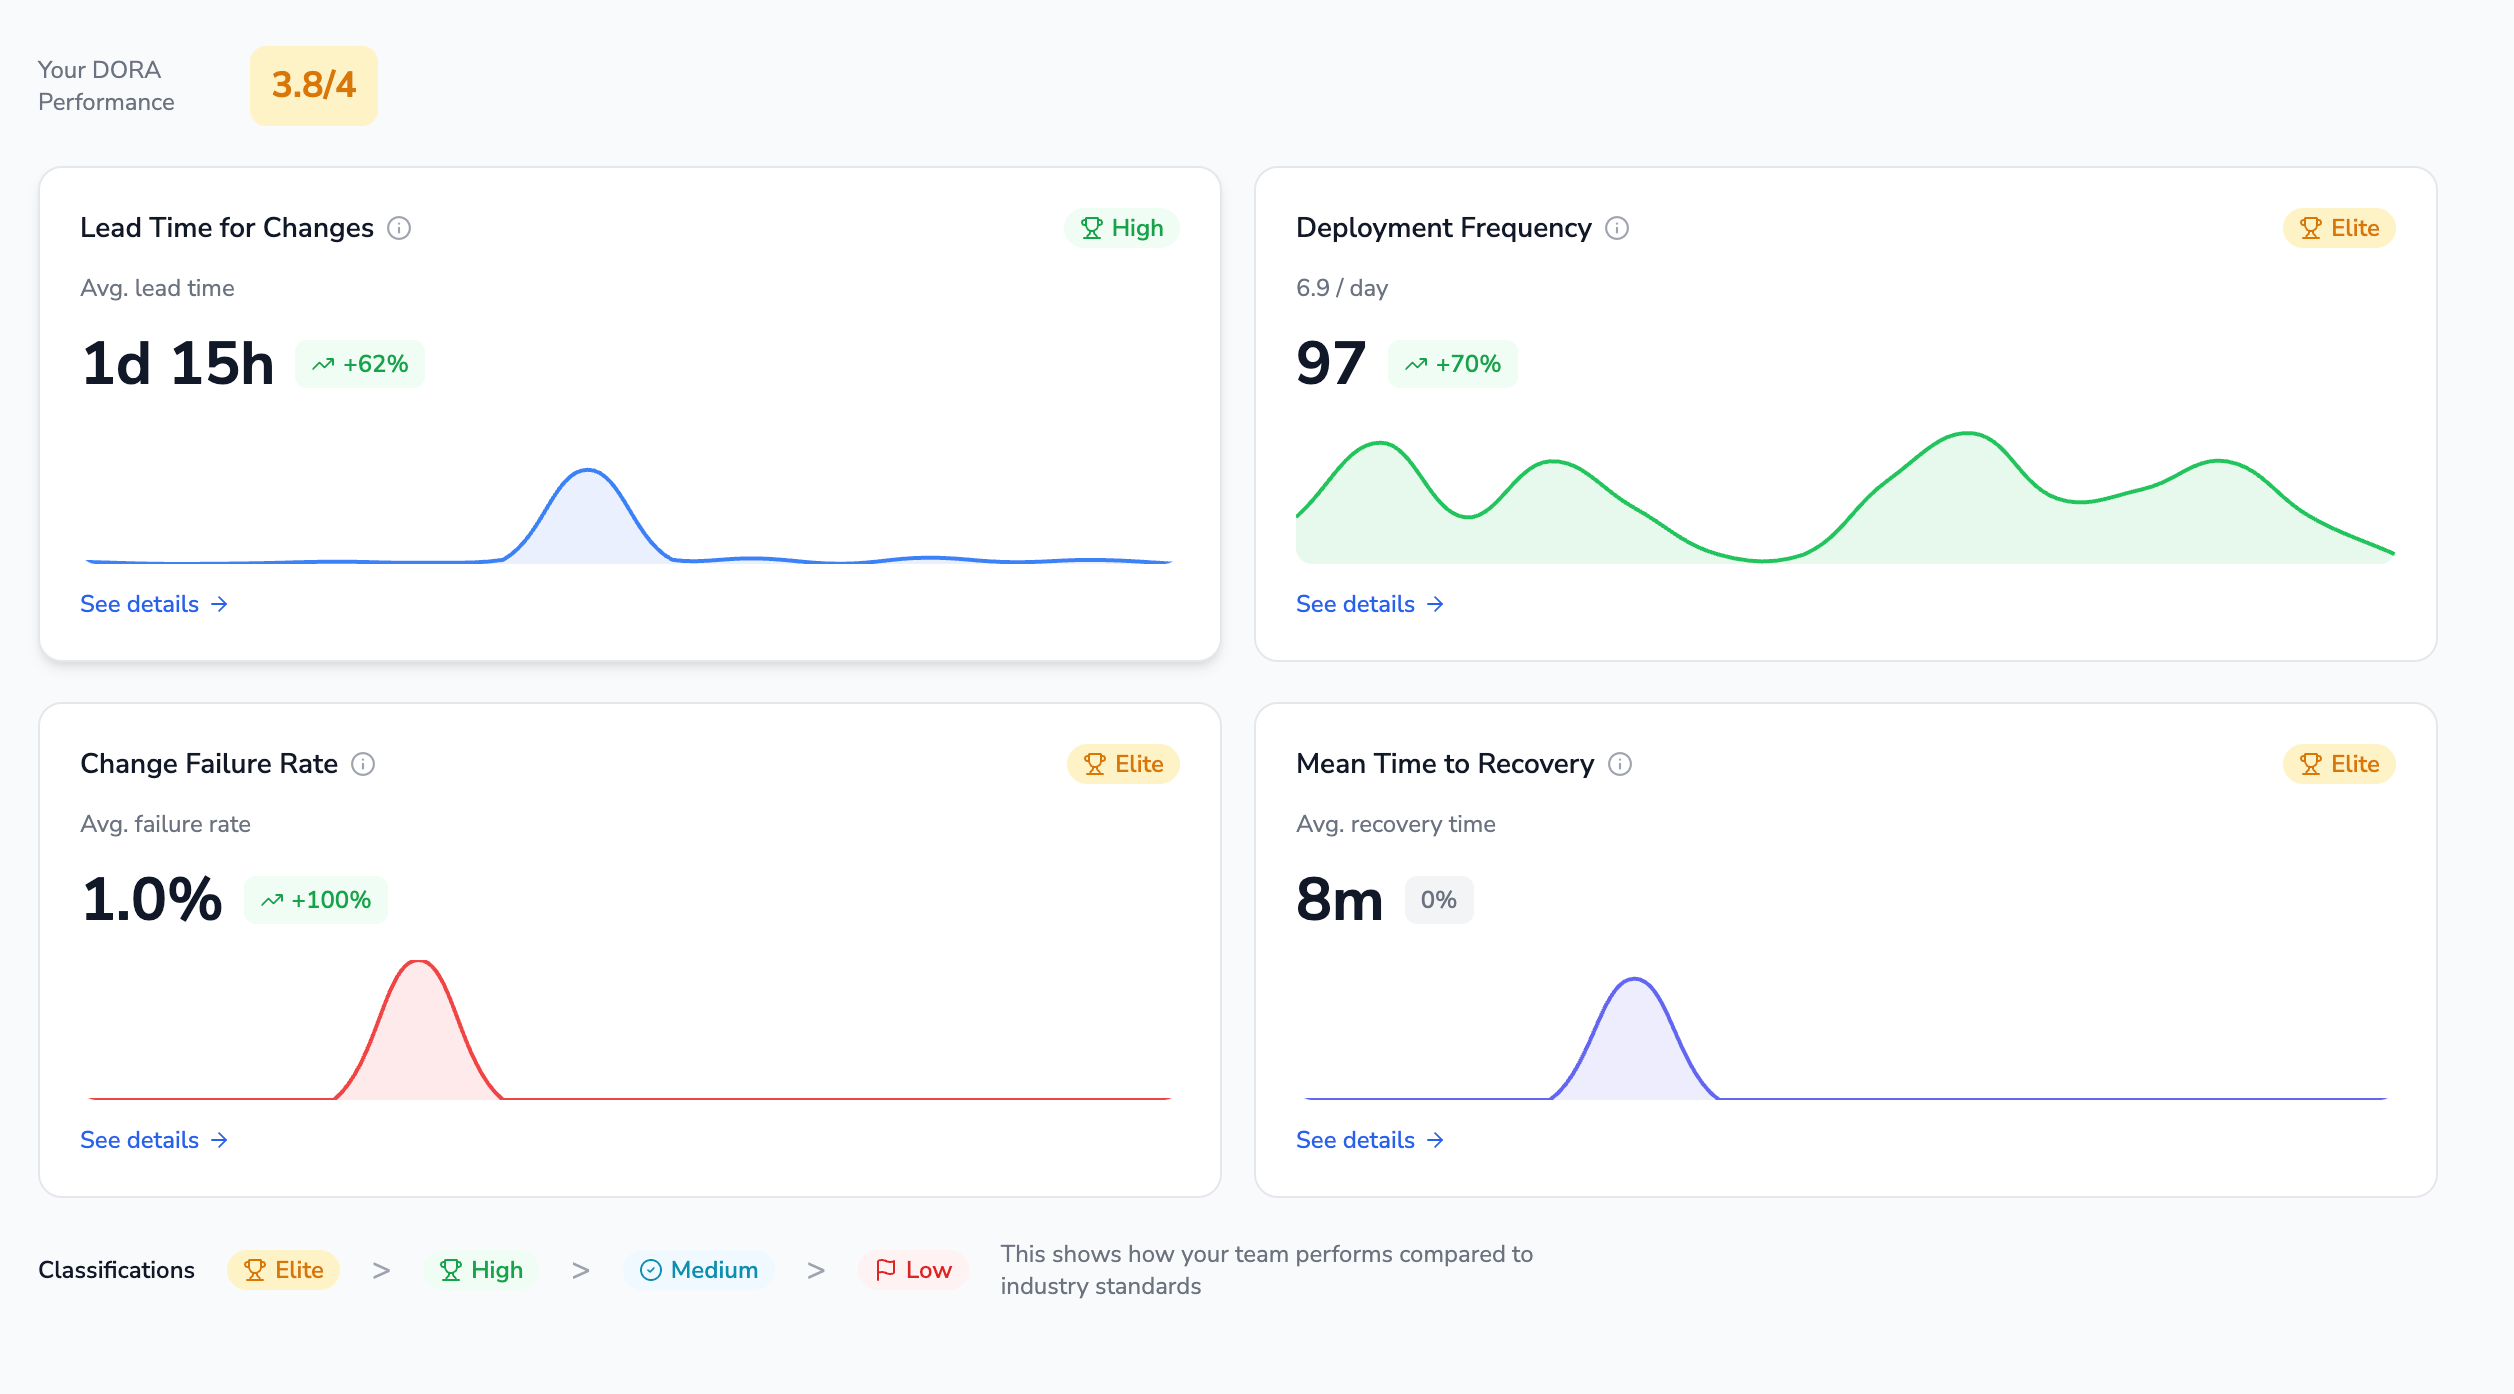
CodeAnt AI computes all four standard DORA metrics. Each metric is rated against industry benchmarks and includes trend comparison against the previous period of equal length.
### Composite DORA Score
The overall DORA score is the average of all four individual metric ratings, converted to a numeric scale:
| Rating | Score |
| ------ | ----- |
| Elite | 4 |
| High | 3 |
| Medium | 2 |
| Low | 1 |
The composite score is calculated by averaging the four scores and rounding to the nearest level. For example, if your metrics rate as Elite (4), High (3), Elite (4), and Medium (2), your composite score would be 3.25 - rated **High**.
The dashboard displays your composite DORA score alongside all four metric cards, each with its rating, trend, and daily chart.
Each row shows:
* **Team Name** and description
* **Repositories & Branch Rules** - the repos in the team along with their configured production branch patterns
* **Status** - Active or Inactive
* **Actions** - View metrics, edit, or delete the team
From this page you can:
* **Add repositories** to an existing team
* **Remove repositories** from a team
* **Update repository config** - change the production branches or deployment type for a specific repository within the team
* **Edit team details** - update the team name, description, or active status
* **Delete a team** - delete the team
***
## DORA Dashboard
CodeAnt AI computes all four standard DORA metrics. Each metric is rated against industry benchmarks and includes trend comparison against the previous period of equal length.
### Composite DORA Score
The overall DORA score is the average of all four individual metric ratings, converted to a numeric scale:
| Rating | Score |
| ------ | ----- |
| Elite | 4 |
| High | 3 |
| Medium | 2 |
| Low | 1 |
The composite score is calculated by averaging the four scores and rounding to the nearest level. For example, if your metrics rate as Elite (4), High (3), Elite (4), and Medium (2), your composite score would be 3.25 - rated **High**.
The dashboard displays your composite DORA score alongside all four metric cards, each with its rating, trend, and daily chart.
 ***
### Deployment Frequency
**What it measures:** How often your team successfully deploys code to production.
What counts as a deployment depends on the repository's deployment mode:
* **Merge-based:** a pull request merged into a production branch. Note this is a proxy - a release branch that takes many merges but ships once will over-count.
* **Pipeline:** a successful run of a production pipeline stage / environment (matching the configured stage patterns) on a production branch. Re-deploys with no new merges count; merges that haven't shipped yet don't.
**How it's calculated:**
* Total deployments in the selected date range
* Average deployments per day, per week, and per month
**Performance Ratings:**
| Rating | Threshold |
| ------ | -------------------------------- |
| Elite | 1 or more deployments per day |
| High | 1 or more deployments per week |
| Medium | 1 or more deployments per month |
| Low | Less than 1 deployment per month |
**Dashboard view:**
* Summary card showing total deployments, daily/weekly/monthly averages, and rating
* Daily trend chart showing deployment count per day over the selected period
* Trend comparison (up/down/flat) against the previous period
***
### Lead Time for Changes
**What it measures:** The time from first commit to production deployment - DORA's *change lead time*.
Lead time tracks the full lifecycle of a change, starting from the first commit on the pull request branch:
* **Merge-based repositories:** lead time ends when the PR is merged into a production branch (merge is the deployment event).
* **Pipeline repositories:** lead time ends at the **first successful production deployment that shipped the change**, so the merge-to-deploy gap is included. Changes merged but not yet deployed count up to merge only.
**How it's calculated:**
* Average and median lead time across all merged PRs in the period
**Performance Ratings:**
| Rating | Threshold |
| ------ | ----------------------------- |
| Elite | Less than 24 hours |
| High | Less than 1 week (168 hours) |
| Medium | Less than 30 days (720 hours) |
| Low | 30 days or more |
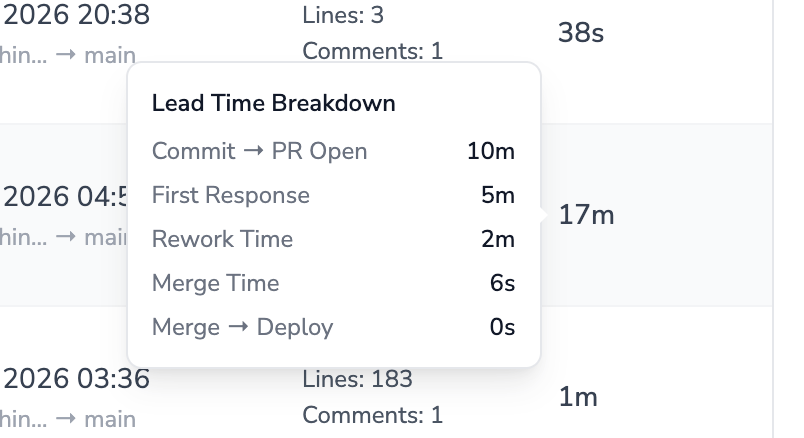
**Lead Time Stages:**
Lead time is broken down into five stages, giving you visibility into where time is spent in your delivery pipeline:
| Stage | Label in UI | Description |
| ------------------------ | ---------------- | ------------------------------------------------------------------------------------------------------------------------------------------------------------------------------------------------------------- |
| **First Commit to Open** | Commit → PR Open | Time between the earliest commit on the PR branch and the PR creation. Measures how long code sits before a PR is opened. |
| **First Response Time** | First Response | Time from the first commit to the first review comment or approval. Measures how quickly reviewers engage. |
| **Rework Time** | Rework Time | Time from the first review to the last approval. Captures the review iteration cycle - back-and-forth between reviewer feedback and author updates until final approval. |
| **Merge Time** | Merge Time | Time from the last approval to the PR being merged. Measures post-approval delay. |
| **Merge to Deploy** | Merge → Deploy | Time from PR merge to the first successful production deployment that shipped it. Measured for pipeline-mode repositories; shown as **Not tracked** for merge-based repositories (there is no deploy signal). |
Each stage reports average and median values in both seconds and hours.
**Distribution Buckets:**
The lead time distribution shows how your PRs are spread across time buckets:
* Less than 1 hour
* 1 hour to 24 hours
* 24 hours to 7 days
* 7 days to 30 days
* More than 30 days
**Dashboard view:**
* Summary card with average/median lead time and rating
* Daily trend chart showing average lead time per day
* Per-stage daily breakdown charts
* Distribution histogram
For **Bitbucket** and **Azure DevOps**, detailed review data (first response time, rework time, merge time) is loaded on-demand. Click **Load review details** on a specific PR in the drill-down to fetch and cache this data.
***
### Change Failure Rate
**What it measures:** The percentage of deployments that fail or require immediate intervention after deploying (rollback or hotfix), per DORA's *change fail rate*.
What counts as a failed change depends on the repository's deployment mode:
* **Merge-based:** a **revert PR** - a pull request that reverts a previously merged change (detected from revert PR titles).
* **Pipeline:** a production deployment that needed intervention, for any of three reasons:
* the pipeline run **failed**,
* the deployment was **rolled back** (a later deployment re-deployed an earlier commit), or
* the deployment **shipped a change that was later reverted**. (If the revert ships in the same deployment, the bad change never went live and it is not counted.)
**How it's calculated:**
* `(Failed changes / Total deployments) × 100`
* Pipeline repositories additionally report a **Deployment Rework Rate**: the share of deployments that were unplanned remediation - rollbacks and deploys that shipped reverts - per DORA's instability guidance.
**Performance Ratings:**
| Rating | Threshold |
| ------ | ---------------- |
| Elite | 0–5% |
| High | 5–10% |
| Medium | 10–15% |
| Low | Greater than 15% |
**Dashboard view:**
* Summary card with CFR percentage, total and failed deployment counts, and rating
* Daily trend chart showing number of failures per day
* List of failed PRs with links to the original reverted PR
***
### Mean Time to Restore (MTTR)
**What it measures:** How quickly your team recovers from a failed deployment, per DORA's *failed deployment recovery time*.
How incidents and recoveries are defined depends on the repository's deployment mode:
* **Merge-based:** an incident is a revert PR; recovery time runs from the original (failed) PR's merge to the revert PR's merge.
* **Pipeline:** an incident is a bad production deployment - a **failed run**, a **rolled-back deployment**, or a deployment whose changes were **later reverted**. Recovery time runs until the deployment that **restored service**: the next successful run of that stage, the rollback landing, or the revert reaching production. This captures roll-forward fixes and infra rollbacks that never touch git.
**How it's calculated:**
* Average and median recovery time across all incidents in the period
* Only resolved incidents (those with a measurable recovery time) contribute to the average; unresolved incidents still count toward the incident total
**Performance Ratings:**
| Rating | Threshold |
| ------ | ---------------------------- |
| Elite | Less than 1 hour |
| High | Less than 24 hours |
| Medium | Less than 1 week (168 hours) |
| Low | 1 week or more |
**Dashboard view:**
* Summary card with average/median MTTR and rating
* Daily trend chart showing average recovery time per day
* List of incidents with recovery time details
***
## Drill-Down Charts
Each DORA metric provides a paginated drill-down view that lets you inspect individual pull requests and incidents. All drill-down tables support sorting and pagination.
### PR Drill-Down (Lead Time)
View every PR merged during the selected period with its full lead time breakdown.
**Columns displayed:**
| Column | Description |
| --------------------- | ----------------------------------------------- |
| Repository | Repository name |
| PR | PR number and title |
| Author | PR author with avatar |
| Base Branch | Target branch the PR was merged into |
| Merged At | Date and time the PR was merged |
| Additions / Deletions | Lines of code added and removed |
| Files Changed | Number of files modified |
| Commits | Number of commits in the PR |
| Reviews | Number of reviews received |
| Lead Time | Total lead time with expandable stage breakdown |
| Is Revert | Whether this PR is a revert |
***
### Deployment Frequency
**What it measures:** How often your team successfully deploys code to production.
What counts as a deployment depends on the repository's deployment mode:
* **Merge-based:** a pull request merged into a production branch. Note this is a proxy - a release branch that takes many merges but ships once will over-count.
* **Pipeline:** a successful run of a production pipeline stage / environment (matching the configured stage patterns) on a production branch. Re-deploys with no new merges count; merges that haven't shipped yet don't.
**How it's calculated:**
* Total deployments in the selected date range
* Average deployments per day, per week, and per month
**Performance Ratings:**
| Rating | Threshold |
| ------ | -------------------------------- |
| Elite | 1 or more deployments per day |
| High | 1 or more deployments per week |
| Medium | 1 or more deployments per month |
| Low | Less than 1 deployment per month |
**Dashboard view:**
* Summary card showing total deployments, daily/weekly/monthly averages, and rating
* Daily trend chart showing deployment count per day over the selected period
* Trend comparison (up/down/flat) against the previous period
***
### Lead Time for Changes
**What it measures:** The time from first commit to production deployment - DORA's *change lead time*.
Lead time tracks the full lifecycle of a change, starting from the first commit on the pull request branch:
* **Merge-based repositories:** lead time ends when the PR is merged into a production branch (merge is the deployment event).
* **Pipeline repositories:** lead time ends at the **first successful production deployment that shipped the change**, so the merge-to-deploy gap is included. Changes merged but not yet deployed count up to merge only.
**How it's calculated:**
* Average and median lead time across all merged PRs in the period
**Performance Ratings:**
| Rating | Threshold |
| ------ | ----------------------------- |
| Elite | Less than 24 hours |
| High | Less than 1 week (168 hours) |
| Medium | Less than 30 days (720 hours) |
| Low | 30 days or more |
**Lead Time Stages:**
Lead time is broken down into five stages, giving you visibility into where time is spent in your delivery pipeline:
| Stage | Label in UI | Description |
| ------------------------ | ---------------- | ------------------------------------------------------------------------------------------------------------------------------------------------------------------------------------------------------------- |
| **First Commit to Open** | Commit → PR Open | Time between the earliest commit on the PR branch and the PR creation. Measures how long code sits before a PR is opened. |
| **First Response Time** | First Response | Time from the first commit to the first review comment or approval. Measures how quickly reviewers engage. |
| **Rework Time** | Rework Time | Time from the first review to the last approval. Captures the review iteration cycle - back-and-forth between reviewer feedback and author updates until final approval. |
| **Merge Time** | Merge Time | Time from the last approval to the PR being merged. Measures post-approval delay. |
| **Merge to Deploy** | Merge → Deploy | Time from PR merge to the first successful production deployment that shipped it. Measured for pipeline-mode repositories; shown as **Not tracked** for merge-based repositories (there is no deploy signal). |
Each stage reports average and median values in both seconds and hours.
**Distribution Buckets:**
The lead time distribution shows how your PRs are spread across time buckets:
* Less than 1 hour
* 1 hour to 24 hours
* 24 hours to 7 days
* 7 days to 30 days
* More than 30 days
**Dashboard view:**
* Summary card with average/median lead time and rating
* Daily trend chart showing average lead time per day
* Per-stage daily breakdown charts
* Distribution histogram
For **Bitbucket** and **Azure DevOps**, detailed review data (first response time, rework time, merge time) is loaded on-demand. Click **Load review details** on a specific PR in the drill-down to fetch and cache this data.
***
### Change Failure Rate
**What it measures:** The percentage of deployments that fail or require immediate intervention after deploying (rollback or hotfix), per DORA's *change fail rate*.
What counts as a failed change depends on the repository's deployment mode:
* **Merge-based:** a **revert PR** - a pull request that reverts a previously merged change (detected from revert PR titles).
* **Pipeline:** a production deployment that needed intervention, for any of three reasons:
* the pipeline run **failed**,
* the deployment was **rolled back** (a later deployment re-deployed an earlier commit), or
* the deployment **shipped a change that was later reverted**. (If the revert ships in the same deployment, the bad change never went live and it is not counted.)
**How it's calculated:**
* `(Failed changes / Total deployments) × 100`
* Pipeline repositories additionally report a **Deployment Rework Rate**: the share of deployments that were unplanned remediation - rollbacks and deploys that shipped reverts - per DORA's instability guidance.
**Performance Ratings:**
| Rating | Threshold |
| ------ | ---------------- |
| Elite | 0–5% |
| High | 5–10% |
| Medium | 10–15% |
| Low | Greater than 15% |
**Dashboard view:**
* Summary card with CFR percentage, total and failed deployment counts, and rating
* Daily trend chart showing number of failures per day
* List of failed PRs with links to the original reverted PR
***
### Mean Time to Restore (MTTR)
**What it measures:** How quickly your team recovers from a failed deployment, per DORA's *failed deployment recovery time*.
How incidents and recoveries are defined depends on the repository's deployment mode:
* **Merge-based:** an incident is a revert PR; recovery time runs from the original (failed) PR's merge to the revert PR's merge.
* **Pipeline:** an incident is a bad production deployment - a **failed run**, a **rolled-back deployment**, or a deployment whose changes were **later reverted**. Recovery time runs until the deployment that **restored service**: the next successful run of that stage, the rollback landing, or the revert reaching production. This captures roll-forward fixes and infra rollbacks that never touch git.
**How it's calculated:**
* Average and median recovery time across all incidents in the period
* Only resolved incidents (those with a measurable recovery time) contribute to the average; unresolved incidents still count toward the incident total
**Performance Ratings:**
| Rating | Threshold |
| ------ | ---------------------------- |
| Elite | Less than 1 hour |
| High | Less than 24 hours |
| Medium | Less than 1 week (168 hours) |
| Low | 1 week or more |
**Dashboard view:**
* Summary card with average/median MTTR and rating
* Daily trend chart showing average recovery time per day
* List of incidents with recovery time details
***
## Drill-Down Charts
Each DORA metric provides a paginated drill-down view that lets you inspect individual pull requests and incidents. All drill-down tables support sorting and pagination.
### PR Drill-Down (Lead Time)
View every PR merged during the selected period with its full lead time breakdown.
**Columns displayed:**
| Column | Description |
| --------------------- | ----------------------------------------------- |
| Repository | Repository name |
| PR | PR number and title |
| Author | PR author with avatar |
| Base Branch | Target branch the PR was merged into |
| Merged At | Date and time the PR was merged |
| Additions / Deletions | Lines of code added and removed |
| Files Changed | Number of files modified |
| Commits | Number of commits in the PR |
| Reviews | Number of reviews received |
| Lead Time | Total lead time with expandable stage breakdown |
| Is Revert | Whether this PR is a revert |
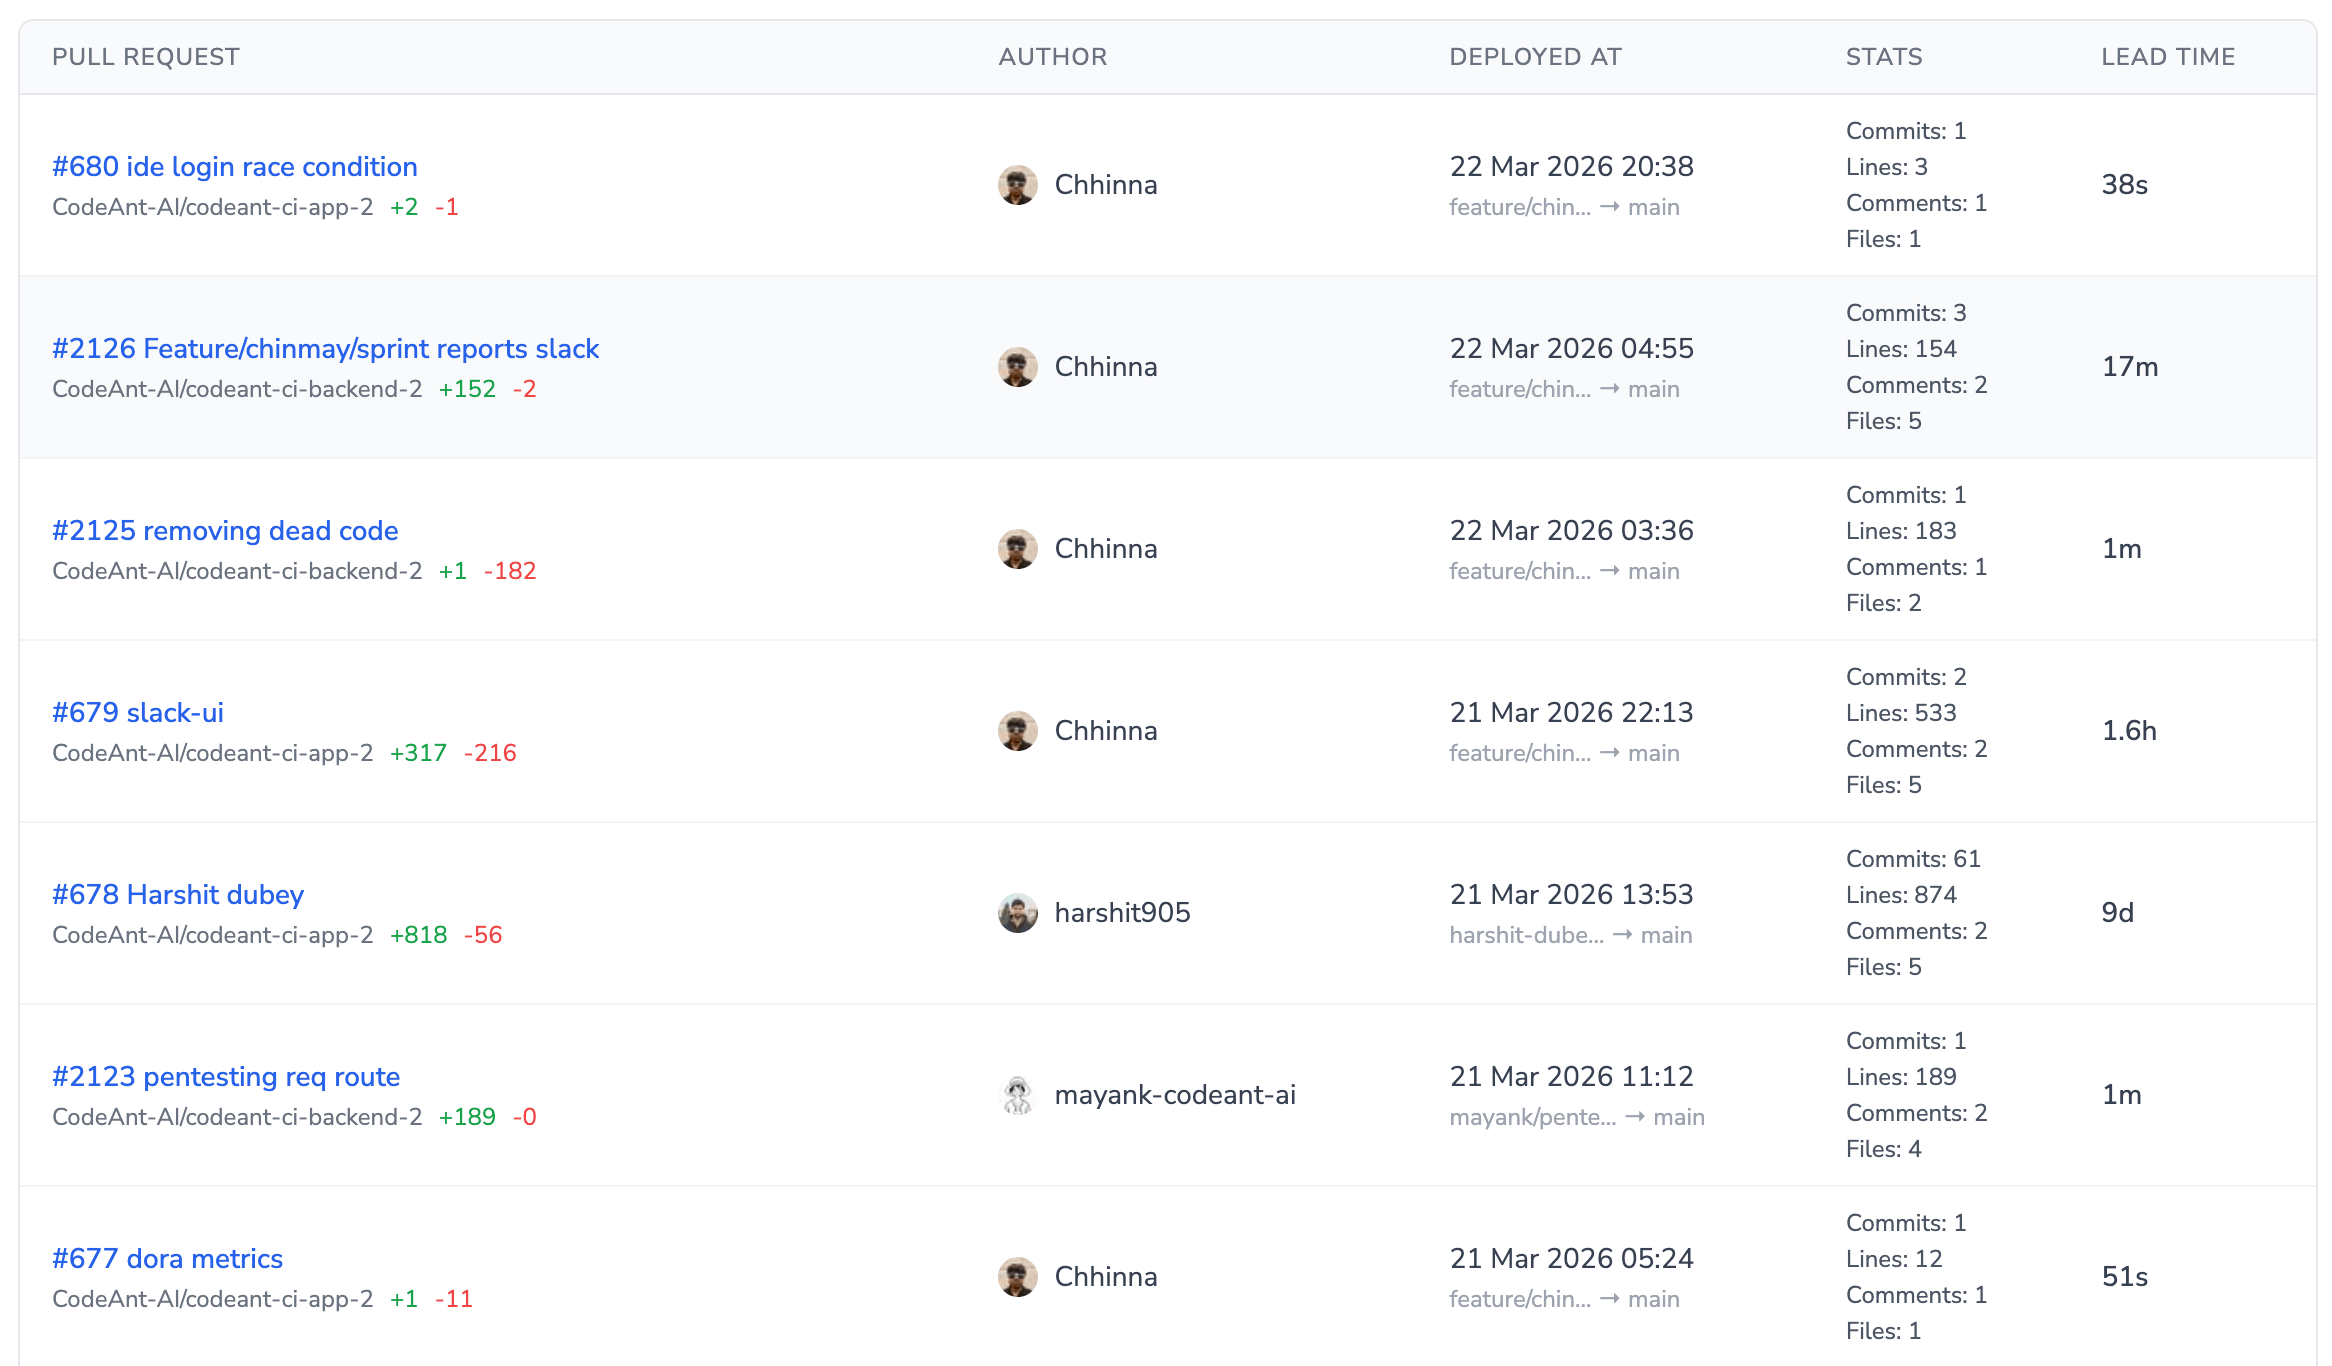 Hover over the lead time value on any PR to see the full stage breakdown:
 ### Deployment Drill-Down
View all deployments in the period. Every row is a deployment: pipeline-mode repositories show their production stage runs, merge-based repositories show one "Merge deployment" row per merged PR.
**Columns displayed:**
| Column | Description |
| ------------- | ------------------------------------------------------------------------------------------------------------------------------------------------------------------------------------------------------------------------------------------------------------------------------------------------- |
| Deployment | For pipeline rows: the pipeline name, linked to the run (for GitHub, the Actions workflow name behind the deployment). For merge-based rows: "Merge deployment". The repository and run number are shown beneath. |
| Deployed At | Deployment timestamp and the deployed branch |
| Stage | *(Pipeline rows)* The stage / environment name and how long the run took |
| Pull Requests | The PRs this deployment shipped, with links. Pipeline deployments carry every PR merged since the previous successful run of the same stage (matched exactly by merge-commit SHA where available); a deployment with no new merges (a re-deploy) shows none. Merge deployments show their own PR. |
### Failure Drill-Down
View all failed changes: revert PRs (merge-based repositories) and production deployments that needed intervention (pipeline repositories).
**Columns displayed:**
| Column | Description |
| ------------- | ------------------------------------------------------------------------------------------------------------------------------------------------------------------------------------------------------ |
| Failed Change | For merge-based rows: the revert PR number and title. For pipeline rows: the pipeline / stage linked to the run, with the reason beneath - *Failed run*, *Rolled back*, or *Shipped a reverted change* |
| Author | Who created the revert (merge-based rows) |
| Failed At | When the failure occurred |
| Recovered By | The revert PR (merge-based rows) or the recovering deployment run, linked (pipeline rows) |
| Recovery Time | Time until the change was reverted / service was restored |
### Incident Drill-Down
View all production incidents with recovery time details. Incidents are revert PRs (merge-based repositories) or bad production deployments (pipeline repositories - failed runs, rollbacks, and later-reverted changes).
**Columns displayed:**
| Column | Description |
| ------------- | -------------------------------------------------------------------------------------------------------------------------------- |
| Incident | For merge-based rows: the revert PR. For pipeline rows: the pipeline / stage linked to the run, with the incident reason beneath |
| Author | Who resolved the incident (merge-based rows) |
| Incident At | When the incident occurred |
| Recovered By | The revert PR or the recovering deployment run, linked |
| Recovery Time | Time to restore service (hours). Unresolved incidents show no recovery time and are excluded from the average |
***
## Filters
DORA Metrics support filtering at multiple levels to help you focus on the data that matters.
### Team-Level Filters
| Filter | Description |
| -------------- | ------------------------------------------------------------------------------------------------------------------------------------------- |
| **Team** | Select a team to view aggregated metrics across all repositories in that team. |
| **Date Range** | Choose a start and end date for the analysis period. The previous period of the same length is automatically computed for trend comparison. |
### Repo-Level Filters
| Filter | Description |
| ----------------------- | ---------------------------------------------------------------------------------------------------------------------------------------------------- |
| **Repository** | When viewing a team, you can filter to a single repository within the team. This preserves the team's production branch configuration for that repo. |
| **Production Branches** | When viewing a standalone repository (outside a team), you can specify custom production branch patterns to define what counts as a deployment. |
### Drill-Down Filters
All drill-down views support:
| Filter | Description |
| -------------- | ---------------------------------------------------------------------------------- |
| **Sort By** | Choose the column to sort results by (e.g., `merged_at`, `lead_time`). |
| **Sort Order** | Ascending or descending order. |
| **Pagination** | Navigate through results with configurable page size (default: 25 items per page). |
***
## Trend Comparison
Every metric automatically includes a trend comparison against the **previous period**. If you select a 30-day window (e.g., Feb 1 – Mar 2), the previous period is the 30 days immediately before (Jan 2 – Jan 31).
Trends show:
* **Direction:** Up, down, or flat
* **Change percentage:** How much the metric changed compared to the previous period
* **Previous value:** The metric value from the prior period
This helps you quickly understand whether your team's delivery performance is improving, declining, or holding steady.
***
## How It Works
1. **Connect Repositories:** Link your Git repositories (GitHub, GitLab, Bitbucket, or Azure DevOps) to CodeAnt AI.
2. **Create a Team:** Group repositories that belong to a team or service area.
3. **Configure Production Branches:** Set regex patterns for each repository to define which branches represent production.
4. **Choose a Deployment Mode:** Keep the default merge-based mode, or switch repositories whose deploys are pipeline runs to [Pipeline Deployment Mode](#pipeline-deployment-mode) and configure stage / environment patterns.
5. **Automatic Data Collection:** CodeAnt AI continuously collects and caches merged PR data and, for team repositories, CI/CD deployment records - no changes to your pipelines required.
6. **View Metrics:** Open the DORA Metrics dashboard, select your team and date range, and view all four metrics with ratings, trends, and drill-downs.
7. **Drill Down:** Click into any metric to see the individual PRs, deployments, failures, or incidents that contribute to that metric.
8. **Track Improvement:** Use trend comparison and historical data to track how your metrics evolve over time and benchmark against industry standards.
### Deployment Drill-Down
View all deployments in the period. Every row is a deployment: pipeline-mode repositories show their production stage runs, merge-based repositories show one "Merge deployment" row per merged PR.
**Columns displayed:**
| Column | Description |
| ------------- | ------------------------------------------------------------------------------------------------------------------------------------------------------------------------------------------------------------------------------------------------------------------------------------------------- |
| Deployment | For pipeline rows: the pipeline name, linked to the run (for GitHub, the Actions workflow name behind the deployment). For merge-based rows: "Merge deployment". The repository and run number are shown beneath. |
| Deployed At | Deployment timestamp and the deployed branch |
| Stage | *(Pipeline rows)* The stage / environment name and how long the run took |
| Pull Requests | The PRs this deployment shipped, with links. Pipeline deployments carry every PR merged since the previous successful run of the same stage (matched exactly by merge-commit SHA where available); a deployment with no new merges (a re-deploy) shows none. Merge deployments show their own PR. |
### Failure Drill-Down
View all failed changes: revert PRs (merge-based repositories) and production deployments that needed intervention (pipeline repositories).
**Columns displayed:**
| Column | Description |
| ------------- | ------------------------------------------------------------------------------------------------------------------------------------------------------------------------------------------------------ |
| Failed Change | For merge-based rows: the revert PR number and title. For pipeline rows: the pipeline / stage linked to the run, with the reason beneath - *Failed run*, *Rolled back*, or *Shipped a reverted change* |
| Author | Who created the revert (merge-based rows) |
| Failed At | When the failure occurred |
| Recovered By | The revert PR (merge-based rows) or the recovering deployment run, linked (pipeline rows) |
| Recovery Time | Time until the change was reverted / service was restored |
### Incident Drill-Down
View all production incidents with recovery time details. Incidents are revert PRs (merge-based repositories) or bad production deployments (pipeline repositories - failed runs, rollbacks, and later-reverted changes).
**Columns displayed:**
| Column | Description |
| ------------- | -------------------------------------------------------------------------------------------------------------------------------- |
| Incident | For merge-based rows: the revert PR. For pipeline rows: the pipeline / stage linked to the run, with the incident reason beneath |
| Author | Who resolved the incident (merge-based rows) |
| Incident At | When the incident occurred |
| Recovered By | The revert PR or the recovering deployment run, linked |
| Recovery Time | Time to restore service (hours). Unresolved incidents show no recovery time and are excluded from the average |
***
## Filters
DORA Metrics support filtering at multiple levels to help you focus on the data that matters.
### Team-Level Filters
| Filter | Description |
| -------------- | ------------------------------------------------------------------------------------------------------------------------------------------- |
| **Team** | Select a team to view aggregated metrics across all repositories in that team. |
| **Date Range** | Choose a start and end date for the analysis period. The previous period of the same length is automatically computed for trend comparison. |
### Repo-Level Filters
| Filter | Description |
| ----------------------- | ---------------------------------------------------------------------------------------------------------------------------------------------------- |
| **Repository** | When viewing a team, you can filter to a single repository within the team. This preserves the team's production branch configuration for that repo. |
| **Production Branches** | When viewing a standalone repository (outside a team), you can specify custom production branch patterns to define what counts as a deployment. |
### Drill-Down Filters
All drill-down views support:
| Filter | Description |
| -------------- | ---------------------------------------------------------------------------------- |
| **Sort By** | Choose the column to sort results by (e.g., `merged_at`, `lead_time`). |
| **Sort Order** | Ascending or descending order. |
| **Pagination** | Navigate through results with configurable page size (default: 25 items per page). |
***
## Trend Comparison
Every metric automatically includes a trend comparison against the **previous period**. If you select a 30-day window (e.g., Feb 1 – Mar 2), the previous period is the 30 days immediately before (Jan 2 – Jan 31).
Trends show:
* **Direction:** Up, down, or flat
* **Change percentage:** How much the metric changed compared to the previous period
* **Previous value:** The metric value from the prior period
This helps you quickly understand whether your team's delivery performance is improving, declining, or holding steady.
***
## How It Works
1. **Connect Repositories:** Link your Git repositories (GitHub, GitLab, Bitbucket, or Azure DevOps) to CodeAnt AI.
2. **Create a Team:** Group repositories that belong to a team or service area.
3. **Configure Production Branches:** Set regex patterns for each repository to define which branches represent production.
4. **Choose a Deployment Mode:** Keep the default merge-based mode, or switch repositories whose deploys are pipeline runs to [Pipeline Deployment Mode](#pipeline-deployment-mode) and configure stage / environment patterns.
5. **Automatic Data Collection:** CodeAnt AI continuously collects and caches merged PR data and, for team repositories, CI/CD deployment records - no changes to your pipelines required.
6. **View Metrics:** Open the DORA Metrics dashboard, select your team and date range, and view all four metrics with ratings, trends, and drill-downs.
7. **Drill Down:** Click into any metric to see the individual PRs, deployments, failures, or incidents that contribute to that metric.
8. **Track Improvement:** Use trend comparison and historical data to track how your metrics evolve over time and benchmark against industry standards.