Why RAG is not the primary component
Code has inherent structural relationships - functions call other functions, modules import dependencies, classes inherit from parents. These relationships are explicit and deterministic. When reviewing code, we need to traverse these exact relationships, not approximate them.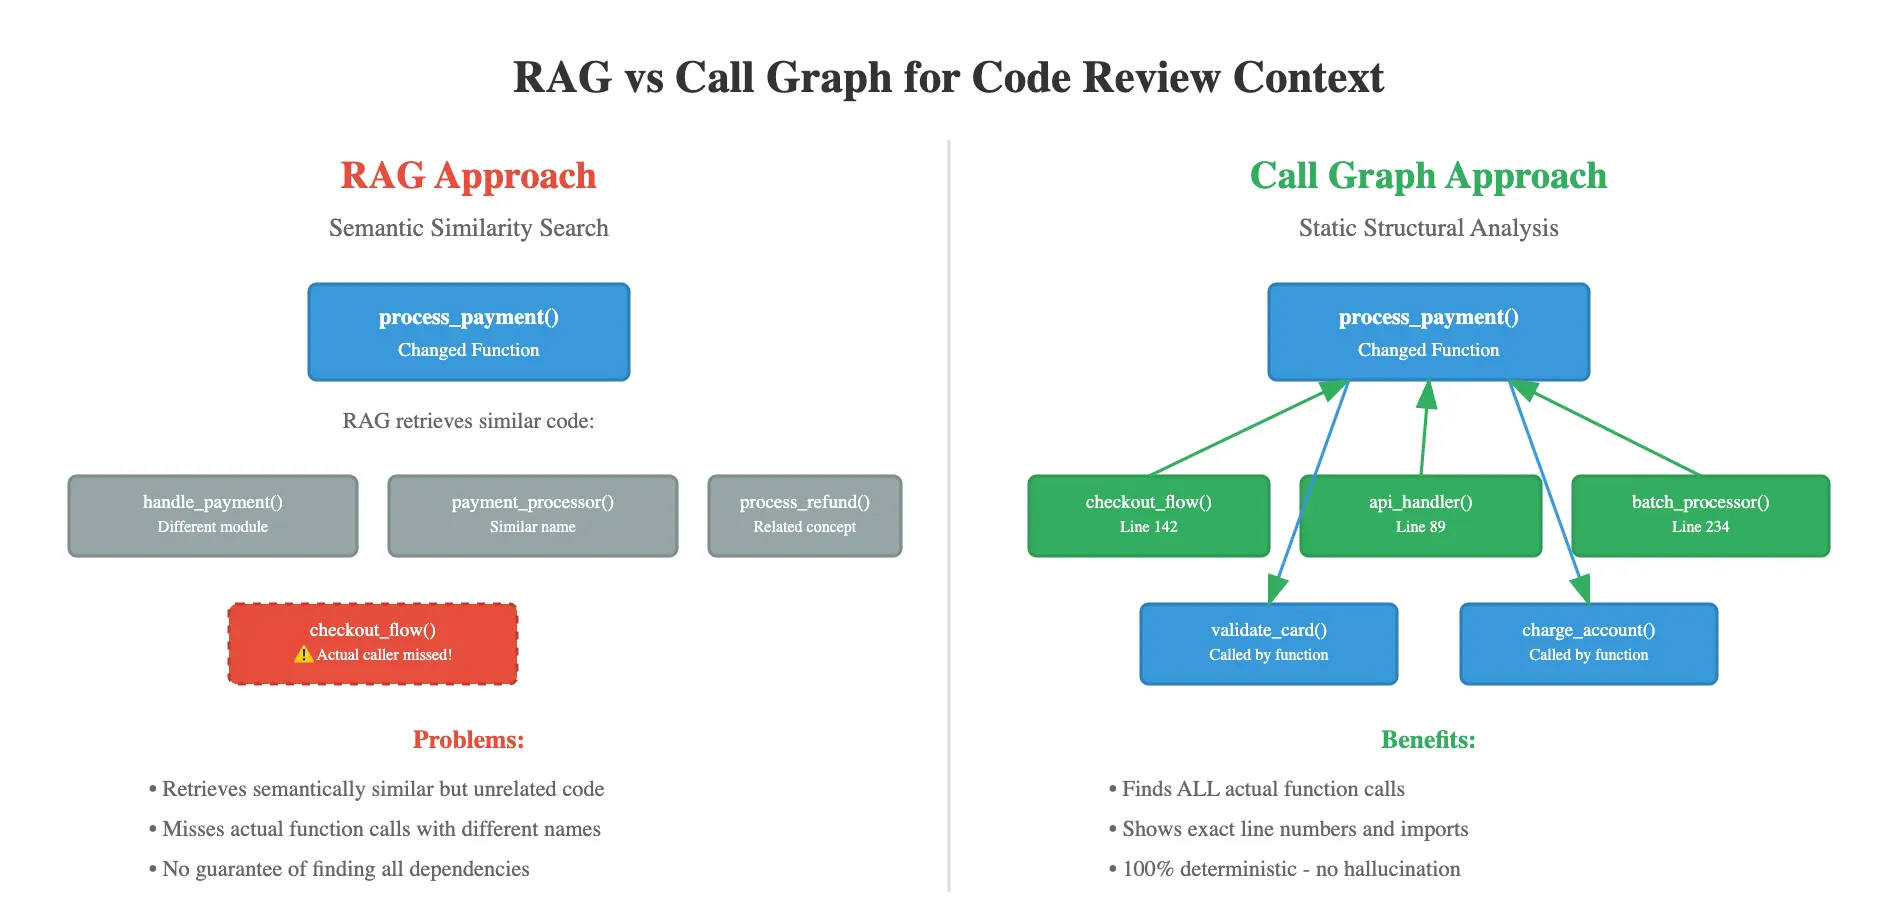
LSP is not the answer
When developers hear “call graph,” the immediate suggestion is often “just use LSP (Language servers).” It’s an understandable reaction - LSP has revolutionized code intelligence in editors. But for production call-graph systems supporting hundreds of languages, LSP creates more problems than it solves.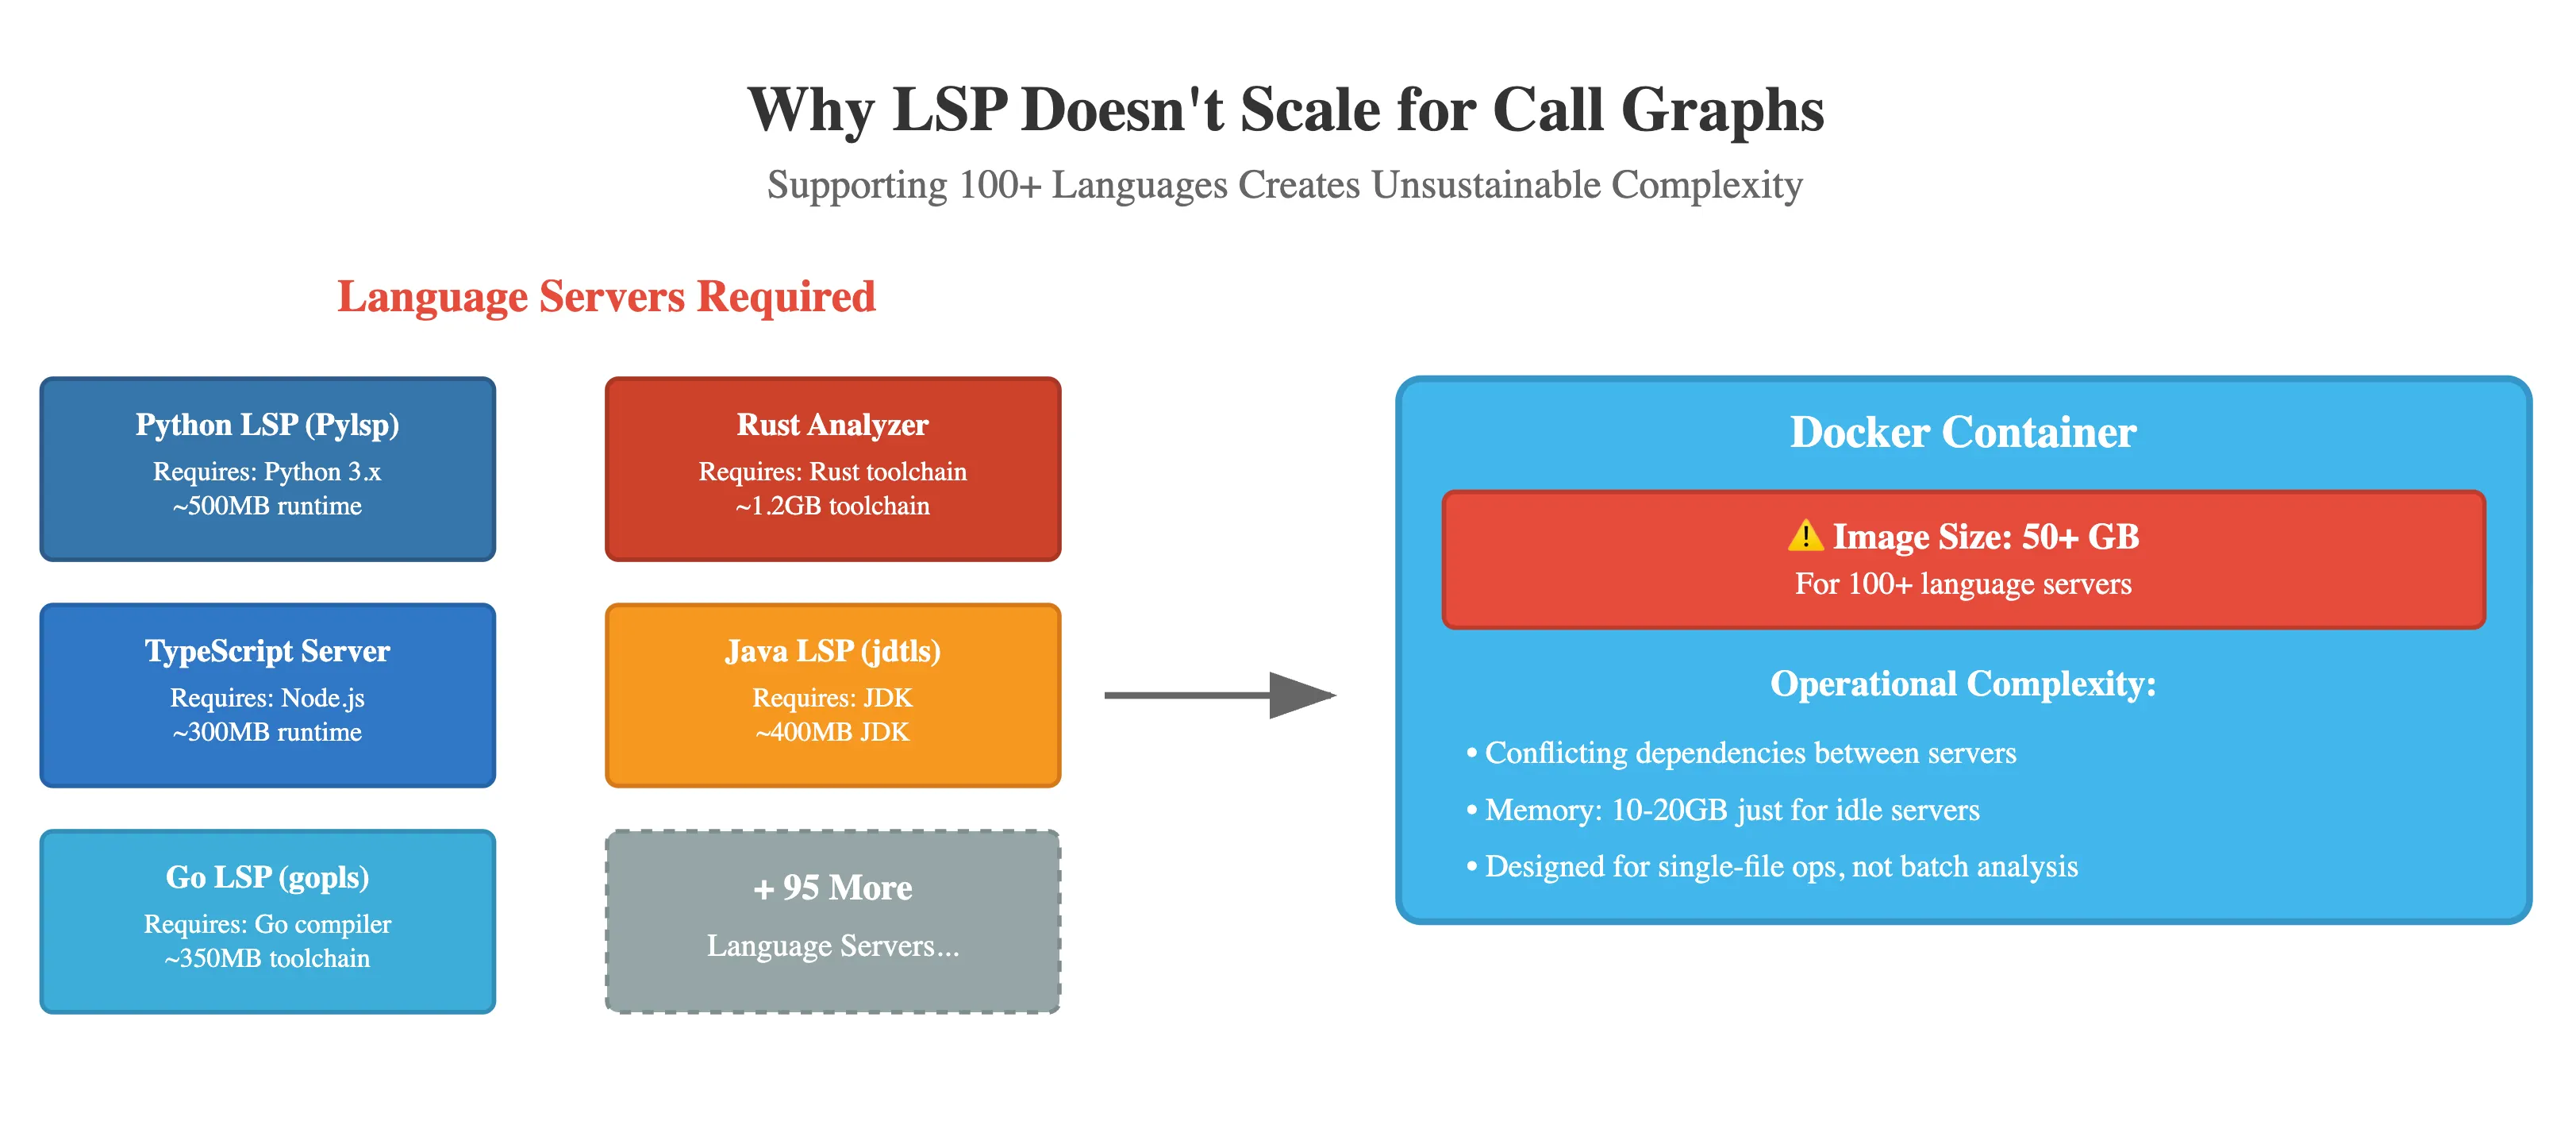
- Python’s Pylsp requires a Python runtime
- Rust analyzer needs the Rust toolchain
- TypeScript server requires Node.js
- Java language server needs the JDK
- Go’s gopls requires the Go compiler
Static Call Graph
We came up with static call graph to answer all of these questions. We built our own call-graph generation system with a focus on accuracy, completeness, and language-agnostic support.Ctags
The key insight was to leverage an existing tool - Ctags - as a starting point. Ctags is a classic tool that indexes symbols (functions, classes, variables, etc.) in source code across many languages. However, using Ctags alone was not sufficient to build an accurate call graph. Ctags knows where things are defined, but not necessarily which one is being called in a given spot if names collide. For example, if two different modules each have a function namedcompute(), Ctags will happily index both definitions. If our code calls compute(), a naive lookup in the Ctags index would return both candidate definitions.
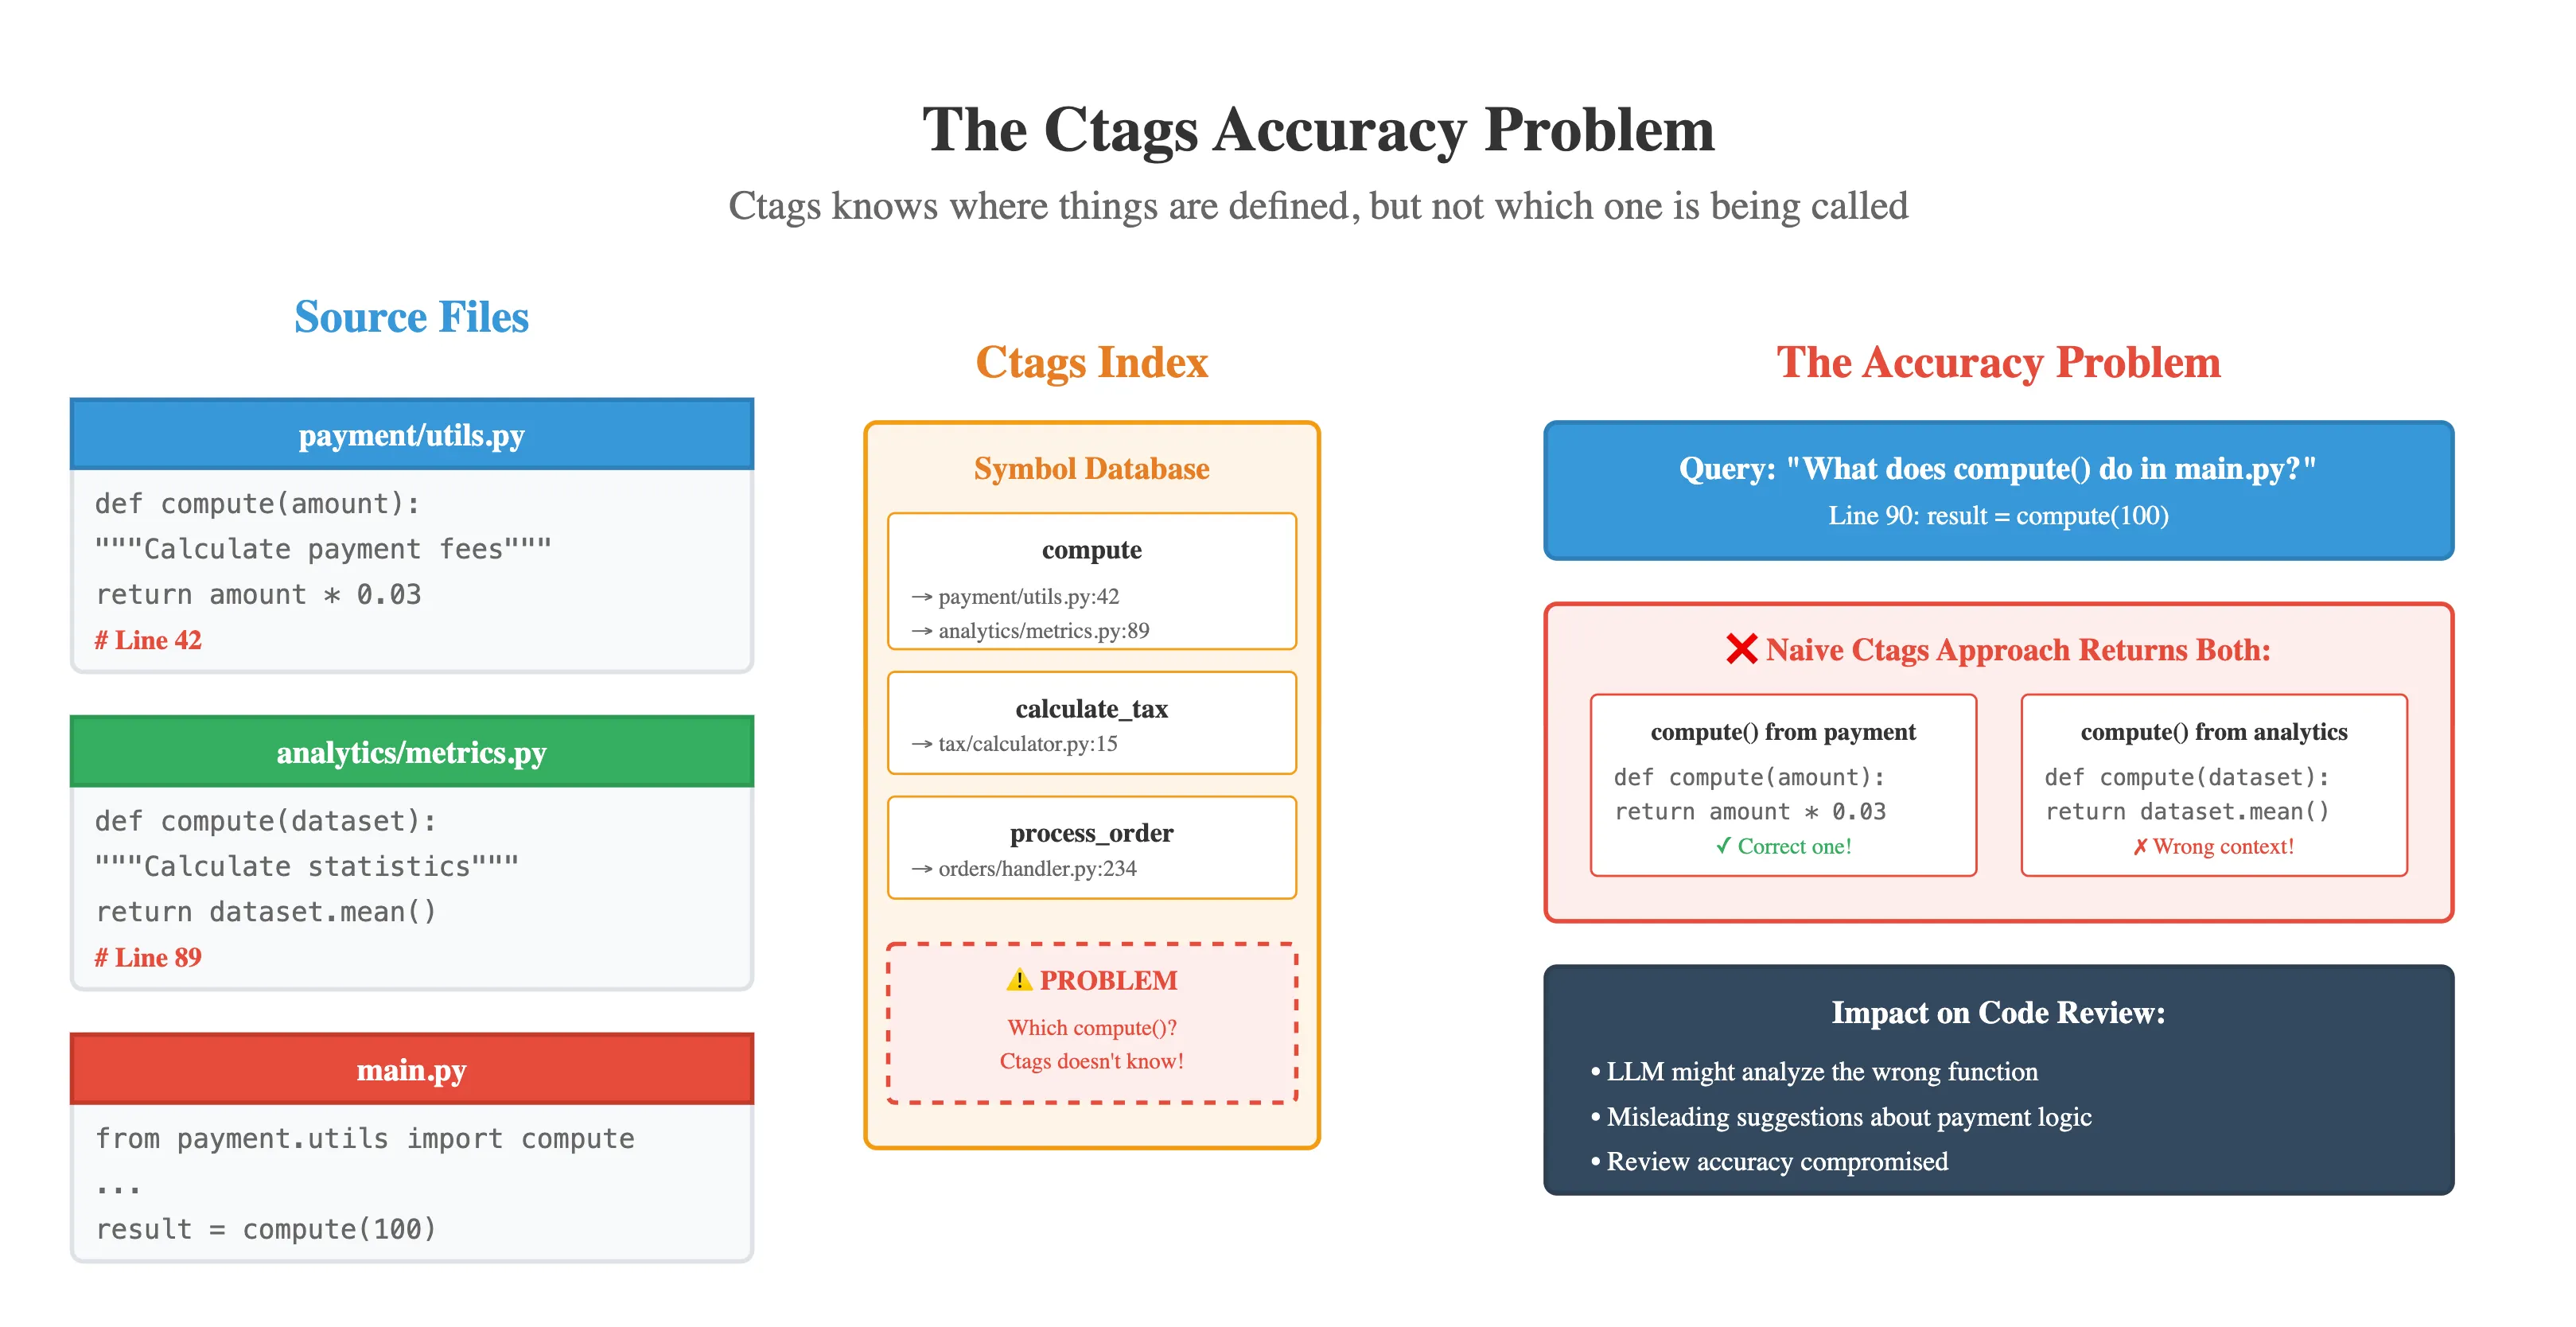
compute() function from another module) would be misleading and could derail the review.
Building Our Context-Aware Call Graph
The solution emerged from combining two powerful tools: Ctags for its broad language support and tree-sitter for precise syntax analysis. Here’s how we made them work together to achieve the accuracy we needed.Step 1 - Creating the Symbol Universe with Ctags
We start by unleashing Ctags on the entire codebase. Within seconds, it indexes every function, class, and variable across hundreds of files - regardless of programming language. This gives us our “universe of possibilities”: every place wherecompute(), process(), or any other function might be defined.
Step 2 - Finding Who’s Calling Whom
Next comes tree-sitter. While Ctags built our directory of definitions, tree-sitter reads through the code to find every function call. It understands the actual structure of the code - not just pattern matching, but real syntax trees. When it encountersresult = compute(100), tree-sitter knows this is a function call, not a variable assignment or a string.
Step 3 - The Candidate Lineup
For each function call tree-sitter finds, we query our Ctags index. This is where things get interesting. A call tocompute() might return three different candidates from completely different modules. Without further analysis, we’re looking at a three-way ambiguity.
This is exactly what breaks naive approaches. Some tools would just pick the first match or show all three. But in code review, precision matters - showing the wrong compute() function could lead to completely incorrect review feedback.
Step 4 - Import Resolution
Here’s where our approach shines. We analyze the imports at the top of each file to resolve which specific function is being called. The implementation adapts to each language’s import system: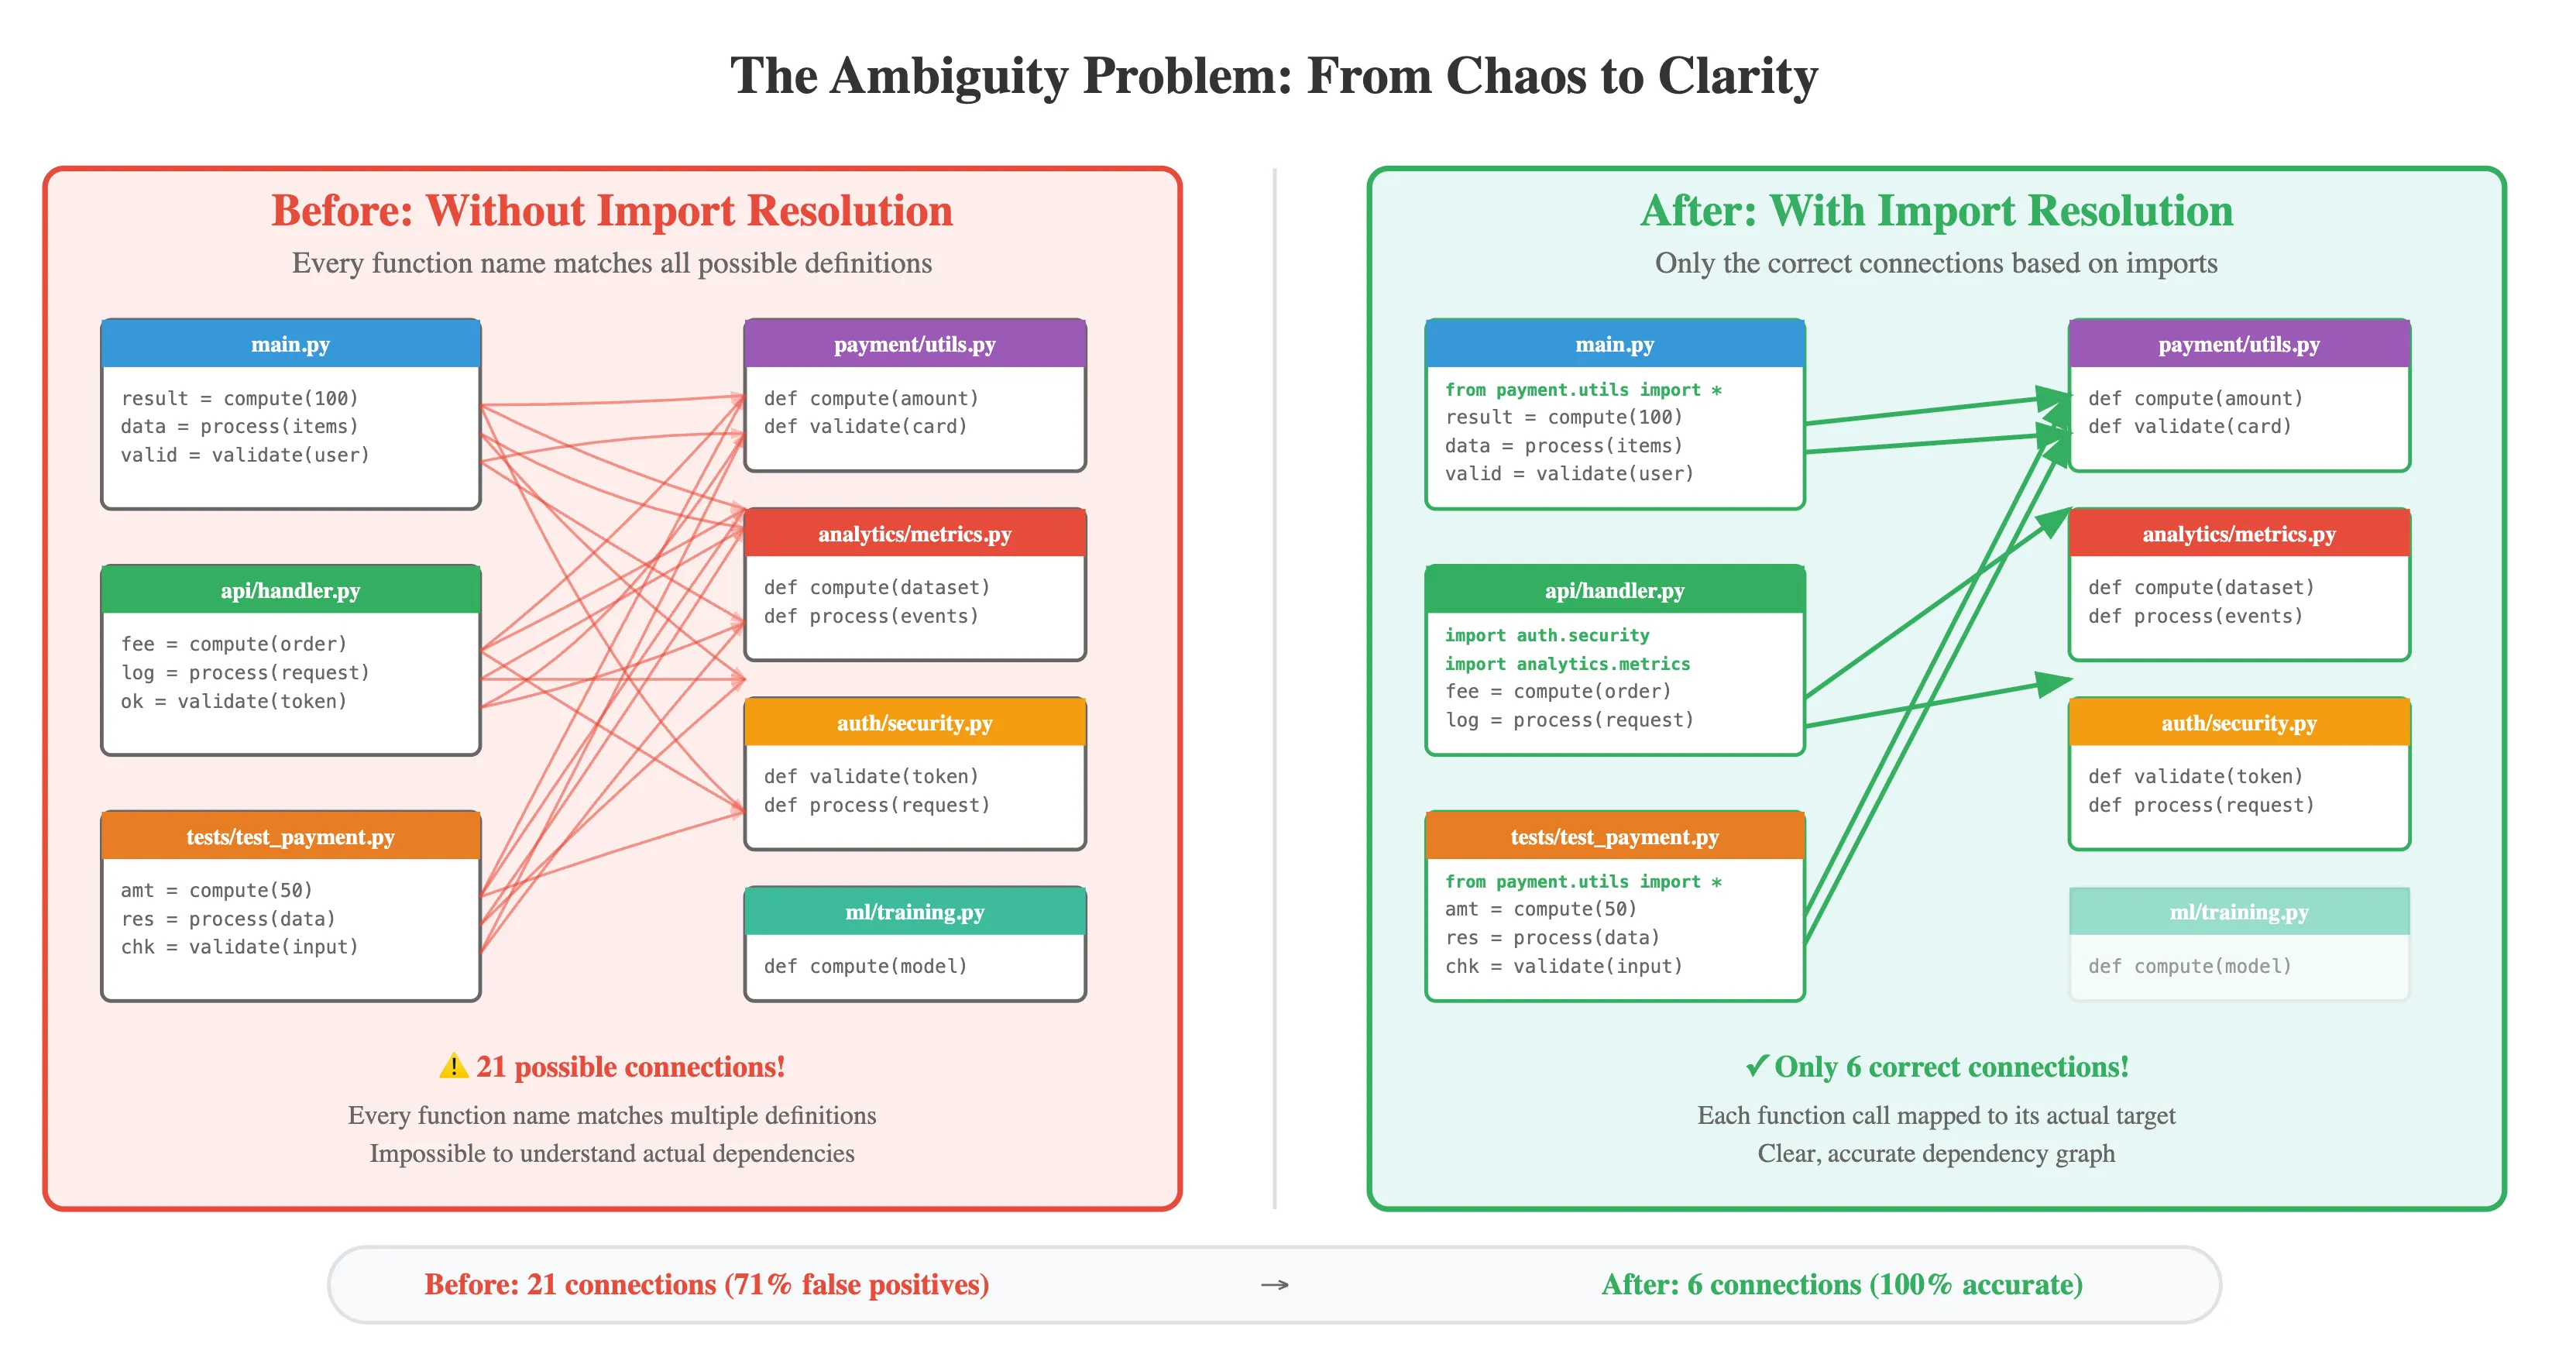
- Python’s import trail: When we see
from payment.utils import compute, we know exactly whichcompute()wins. Even with relative imports likefrom ..utils import compute, we resolve the path relative to the current file’s location. - JavaScript’s module maze: Whether it’s
import { compute } from './payment/utils'orconst { compute } = require('./analytics/metrics'), we trace through the module system. We handle default exports, named exports, and even barrel exports that re-export from other files. - Java’s package precision: Fully qualified calls like
com.payment.Utils.compute()are obvious, but we also resolve simplecompute()calls by checking theimport com.payment.Utils;statements. We even handle wildcard imports, though they require checking each potential match. - Local scope wins: If a function is defined in the same file where it’s called, that local definition takes precedence - just like variable-scoping rules in most languages.
Step 5 - Connecting the Dots
Once we’ve identified the correct target for each call, we build the edge in our call graph. But we don’t just store “A calls B” - we preserve rich metadata:compute(), the LLM can see every call site and understand the specific context of each usage.
The beauty of this approach is its scalability. By building on Ctags’ language support, we immediately work with any language it supports - over 40 and counting. The import-resolution logic, while language-specific, follows common patterns that we can implement incrementally as needed.